
Suppose real estate is the most significant investment a majority of people make in their lifetime. In that case, it’s best to understand the places in New York with best potential return on investment.
After working in real estate adjacent roles for over a decade, I had the hypothesis that the best place to buy for a return on investment would be up-and-coming cities. Smaller cities where crime might be high now, but people still move to.
To test my hypothesis, we are going to look at places in New York that are growing faster than average, but where home prices are below average, and crime rates are higher than average.
In everyday terms, these might be “deals”. The best deal in New York at the moment according to Saturday Night Science? That would be Liberty.
Table Of Contents: Top Ten | Methodology | Summary | Table
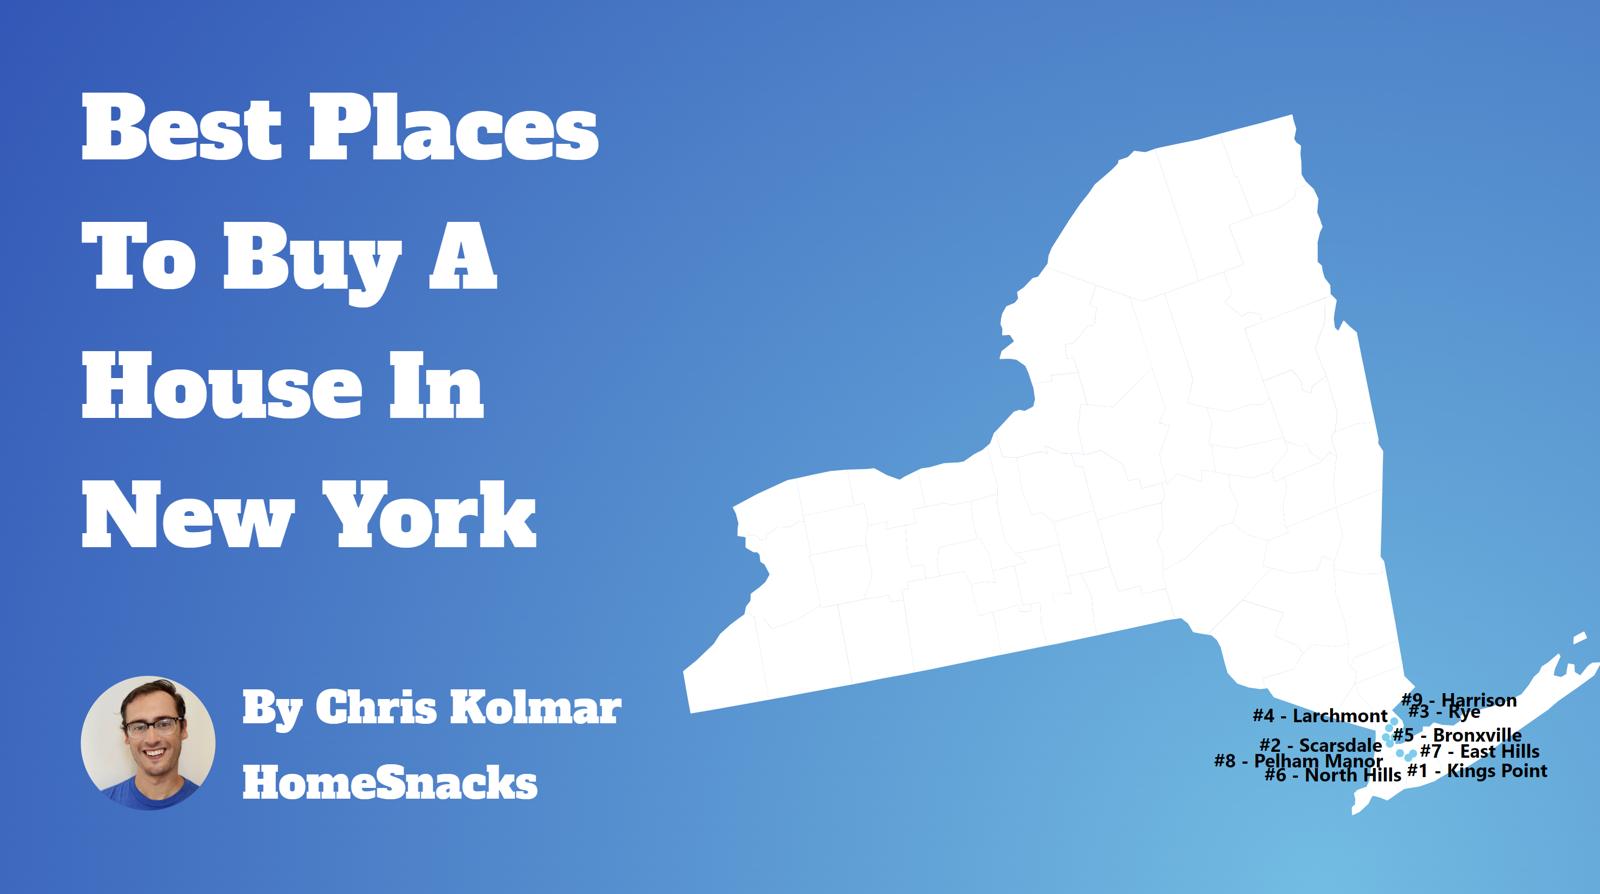
The 10 Best Places To Buy A Home In New York For 2026
The methodology that wen’t into this can be a bit complicated, so we’ll break it down for you in as much detail as we can below.
For more New York reading:
- Best Counties To Live In New York
- Best Places To Raise A Family In New York
- Best Places To Retire In New York
The 10 Best Cities To Buy A House In New York For 2026
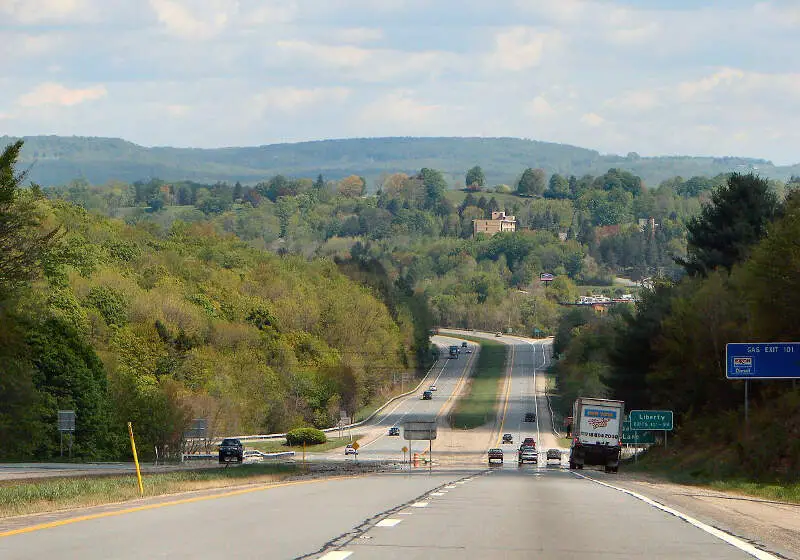
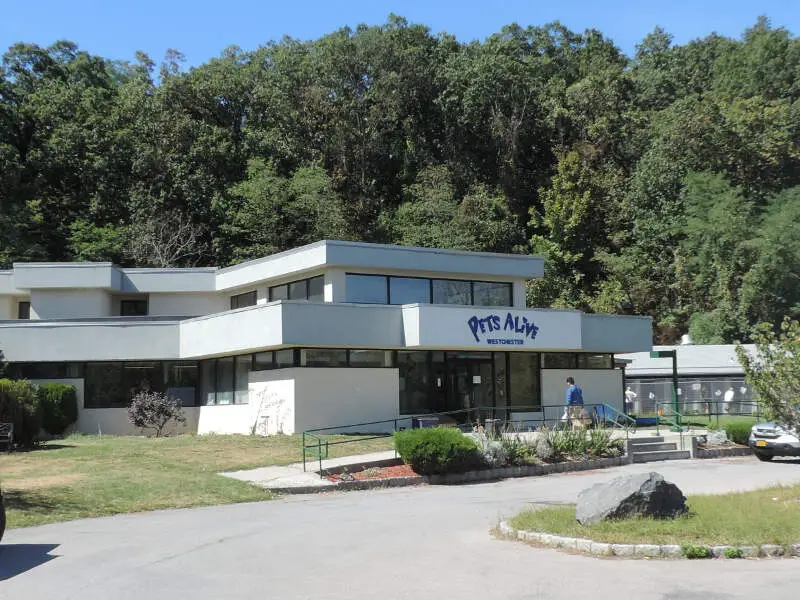
1. Liberty
/10
Population: 5,142
Median Home Price: $217,951
Population Change: 1.2%
Home Price Change: 14.7%
More on Liberty: Crime | Movers

/10
Population: 5,033
Median Home Price: $1,099,756
Population Change: -0.1%
Home Price Change: 2.9%
More on Sea Cliff: Data | Cost Of Living | Movers
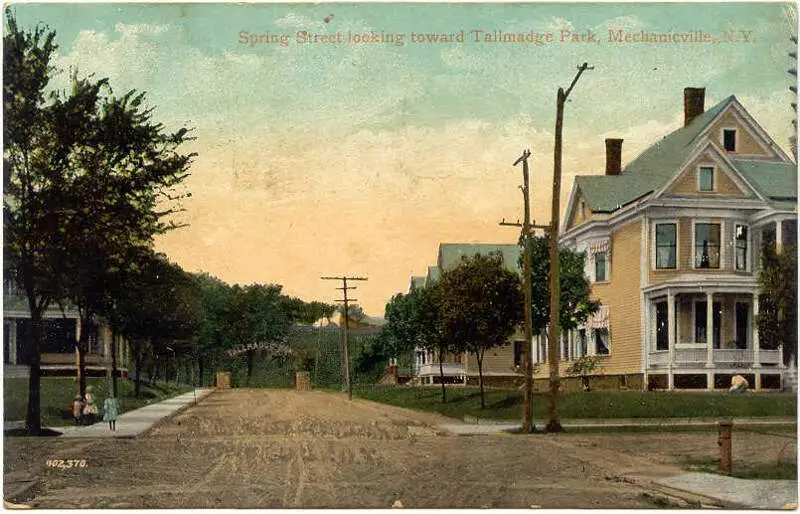
/10
Population: 5,124
Median Home Price: $483,740
Population Change: -0.4%
Home Price Change: 1.1%
More on Mechanicville: Data | Crime | Cost Of Living | Movers
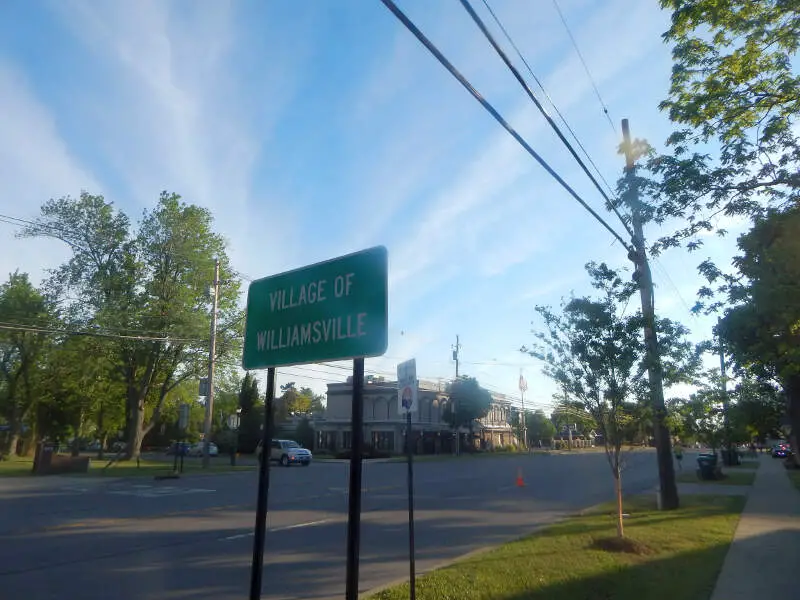
/10
Population: 5,469
Median Home Price: $410,876
Population Change: 0.7%
Home Price Change: 2.1%
More on Williamsville: Data | Cost Of Living | Movers
/10
Population: 5,186
Median Home Price: $678,626
Population Change: 0.1%
Home Price Change: -0.2%
More on Elmsford: Data | Crime | Cost Of Living | Movers
/10
Population: 5,634
Median Home Price: $2,373,620
Population Change: 0.4%
Home Price Change: -1.9%
More on Kings Point: Data | Crime | Cost Of Living | Movers
/10
Population: 5,403
Median Home Price: $396,820
Population Change: -0.6%
Home Price Change: 3.3%
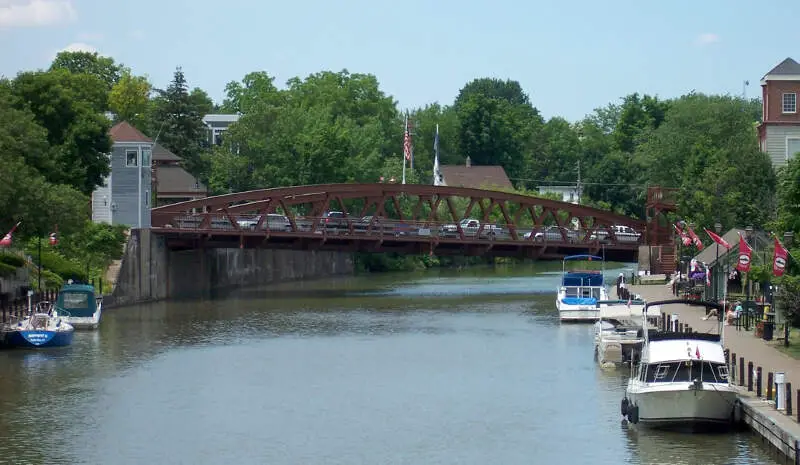
More on Fairport: Data | Crime | Cost Of Living | Movers

/10
Population: 5,773
Median Home Price: $558,034
Population Change: 0.4%
Home Price Change: 1.4%
More on Goshen: Data | Crime | Cost Of Living | Movers
/10
Population: 5,694
Median Home Price: $1,050,815
Population Change: 2.3%
Home Price Change: 0.2%
More on Kaser: Data | Cost Of Living | Movers
/10
Population: 5,472
Median Home Price: $978,444
Population Change: 0.8%
Home Price Change: 9.6%
More on New Hempstead: Data | Cost Of Living | Movers
Methodology: How do you determine the best places to buy a home in New York for 2026?
We were in real estate for almost five years and have worked on this site for another 11. Suffice it to say we’ve put a lot of thought into finding an excellent place to buy a home.
So all that thinking has come to this moment where we get to spell out how we’d approach finding an up-and-coming place to live in New York. Put differently, the analysis will try to find places in New York with undervalued homes relative to pent-up demand using Saturday Night Science.
To do that, we looked at the most recent American Community Survey Census data for 2020-2024 and compared it to the previous vintage. Specifically, we used the following criteria:
- Y-o-Y Change In Population (People want to live here)
- Y-o-Y Change In Median Home Prices (People are willing to pay for it)
- Home Prices Relative To The State Average (It’s still kinda cheap)
We want places that are growing, have seen home prices increase in recent years, and are still “cheap” for New York with the following caveats:
- Home prices had to be within 20% of the state average (Much lower than that, and you get to some of the more dangerous places)
- Home prices increased in the last year, and
- Above 5,000 people (Bigger cities have more data points)
So of the 0 cities and towns in New York, only 168 places made it through our initial filters to even be considered.
We then ranked each place from 1 to 168 for the above criteria, with 1 being the best. We averaged the rankings to create a “best place to buy” index, with the place having the lowest index being the best.
Turns out that Liberty is the best potential gem in the not-so-rough in the Empire State.
Summary: The Best Places To Purchase A House In New York for 2026
There’s our analysis of the best places to buy a house in New York. And, to be clear, we aren’t necessarily saying these places are the best places to live, just that it looks like they might be in a couple of years based on the data.
In fact, every place in the following table meets our criteria, so even though it may not look super long, remember we started off with all 0 places in the state.
The best cities to buy a house in New York are Liberty, Sea Cliff, Mechanicville, Williamsville, Elmsford, Kings Point, Fairport, Goshen, Kaser, and New Hempstead.
So if we’d could rent or buy in these cities, we’d definitely buy.
For more New York reading, check out:
Best Places To Buy A Home In New York
| Rank | City | Population | Median Home Price | Population Change | Home Price Increase |
|---|---|---|---|---|---|
| 1 | Liberty | 5,142 | $217,951 | 1.2% | 14.7% |
| 2 | Sea Cliff | 5,033 | $1,099,756 | -0.1% | 2.9% |
| 3 | Mechanicville | 5,124 | $483,740 | -0.4% | 1.1% |
| 4 | Williamsville | 5,469 | $410,876 | 0.7% | 2.1% |
| 5 | Elmsford | 5,186 | $678,626 | 0.1% | -0.2% |
| 6 | Kings Point | 5,634 | $2,373,620 | 0.4% | -1.9% |
| 7 | Fairport | 5,403 | $396,820 | -0.6% | 3.3% |
| 8 | Goshen | 5,773 | $558,034 | 0.4% | 1.4% |
| 9 | Kaser | 5,694 | $1,050,815 | 2.3% | 0.2% |
| 10 | New Hempstead | 5,472 | $978,444 | 0.8% | 9.6% |
| 11 | Salamanca | 5,846 | $96,933 | -0.5% | -1.6% |
| 12 | Bath | 5,560 | $121,856 | -0.6% | -7.5% |
| 13 | Pelham Manor | 5,644 | $1,309,984 | -0.1% | -3.5% |
| 14 | Albion | 5,506 | $98,611 | 0.2% | -3.9% |
| 15 | Wappingers Falls | 5,761 | $486,032 | 1.2% | 1.7% |
| 16 | Malone | 5,429 | $128,925 | -0.7% | -1.3% |
| 17 | Webster | 5,718 | $386,505 | -0.3% | 2.5% |
| 18 | Ballston Spa | 5,027 | $422,526 | -1.0% | 1.6% |
| 19 | Washingtonville | 5,707 | $516,964 | -0.3% | 0.6% |
| 20 | Hilton | 5,968 | $300,280 | -0.4% | 2.0% |
| 21 | Medina | 5,770 | $172,121 | -0.5% | 1.3% |
| 22 | North Hills | 5,415 | $1,472,339 | -0.1% | -3.8% |
| 23 | Wesley Hills | 6,196 | $1,123,610 | 0.7% | 2.3% |
| 24 | Hudson | 5,865 | $436,089 | -0.6% | -1.0% |
| 25 | Larchmont | 6,567 | $1,661,377 | 0.4% | 2.5% |
| 26 | East Aurora | 5,993 | $431,046 | -0.1% | 1.0% |
| 27 | Solvay | 6,544 | $179,728 | -0.7% | 1.3% |
| 28 | Horseheads | 6,449 | $213,483 | -0.7% | -0.6% |
| 29 | Monticello | 7,279 | $275,473 | 0.4% | 0.4% |
| 30 | Bronxville | 6,510 | $1,450,320 | -0.4% | -0.2% |
| 31 | Canton | 7,167 | $185,238 | -0.8% | 0.4% |
| 32 | Irvington | 6,531 | $1,222,447 | -0.2% | 1.3% |
| 33 | Lawrence | 6,778 | $2,123,230 | 0.1% | 7.7% |
| 34 | East Rochester | 6,218 | $227,076 | -0.7% | 2.6% |
| 35 | Tuckahoe | 6,973 | $815,212 | -0.2% | -0.0% |
| 36 | Norwich | 6,782 | $145,101 | -1.4% | -6.6% |
| 37 | Cedarhurst | 7,320 | $1,206,384 | 0.2% | 3.9% |
| 38 | Walden | 6,868 | $412,020 | -0.0% | 0.0% |
| 39 | Bayville | 6,744 | $841,959 | 0.0% | 1.7% |
| 40 | Manorhaven | 6,958 | $823,278 | 0.3% | -2.6% |
| 41 | North Syracuse | 6,693 | $230,805 | -0.5% | 0.3% |
| 42 | Warwick | 6,585 | $566,346 | -0.6% | 1.8% |
| 43 | Herkimer | 7,566 | $159,599 | 3.1% | 2.2% |
| 44 | Pelham | 7,305 | $1,360,404 | 0.8% | 3.7% |
| 45 | Great Neck Plaza | 7,593 | $498,568 | 1.2% | 3.4% |
| 46 | Hudson Falls | 7,395 | $230,034 | -0.1% | -2.6% |
| 47 | Nyack | 7,393 | $748,480 | -1.0% | 1.2% |
| 48 | New Paltz | 8,314 | $496,651 | 3.6% | -1.1% |
| 49 | East Hills | 7,257 | $1,751,159 | 0.1% | 1.1% |
| 50 | Pleasantville | 7,371 | $987,581 | -0.3% | 0.4% |
| 51 | Williston Park | 7,542 | $927,595 | 0.5% | 3.6% |
| 52 | Northport | 7,322 | $850,558 | 0.0% | -1.6% |
| 53 | Scotia | 7,264 | $249,645 | 0.1% | -0.2% |
| 54 | Colonie | 7,702 | $341,964 | -0.0% | 0.0% |
| 55 | Briarcliff Manor | 7,519 | $1,094,016 | 2.5% | 1.6% |
| 56 | Baldwinsville | 7,715 | $321,319 | -0.2% | 1.5% |
| 57 | Ilion | 7,593 | $147,235 | -0.6% | -2.8% |
| 58 | Hastings-On-Hudson | 8,434 | $1,036,676 | -0.2% | -5.9% |
| 59 | Port Jefferson | 8,091 | $756,205 | 0.8% | 1.1% |
| 60 | Chestnut Ridge | 10,557 | $862,818 | 0.9% | 2.3% |
| 61 | Croton-On-Hudson | 8,202 | $812,905 | -0.0% | 3.3% |
| 62 | Brockport | 7,277 | $269,354 | 1.7% | 1.2% |
| 63 | Geneseo | 7,701 | $271,031 | 0.0% | 3.4% |
| 64 | Johnstown | 8,111 | $192,658 | -0.5% | -0.2% |
| 65 | Hornell | 8,152 | $109,104 | -0.3% | -0.5% |
| 66 | Malverne | 8,477 | $801,813 | -0.2% | 2.1% |
| 67 | Port Jervis | 8,652 | $310,671 | -0.7% | -2.0% |
| 68 | Monroe | 9,515 | $530,516 | 0.5% | -0.7% |
| 69 | New Square | 9,803 | $793,683 | 0.9% | 1.6% |
| 70 | Airmont | 10,205 | $963,994 | 1.2% | 3.6% |
| 71 | Newark | 8,991 | $196,938 | -0.5% | -0.6% |
| 72 | Farmingdale | 8,474 | $717,477 | 0.3% | 2.9% |
| 73 | Potsdam | 8,427 | $177,295 | -0.9% | 0.5% |
| 74 | Rensselaer | 9,287 | $306,689 | 0.4% | 0.2% |
| 75 | Amityville | 9,588 | $587,036 | 0.8% | -2.9% |
| 76 | Rye Brook | 9,900 | $1,236,847 | 0.2% | 3.8% |
| 77 | Massena | 10,238 | $115,435 | 0.0% | -2.9% |
| 78 | Hamburg | 9,792 | $297,870 | 0.3% | -0.9% |
| 79 | New Hyde Park | 10,220 | $974,067 | 0.1% | 2.2% |
| 80 | East Rockaway | 10,077 | $735,012 | 0.1% | 1.2% |
| 81 | Watervliet | 10,287 | $308,696 | 0.0% | 0.9% |
| 82 | Lancaster | 10,113 | $242,274 | -0.1% | 3.0% |
| 83 | Sleepy Hollow | 10,887 | $1,010,736 | 2.8% | 3.7% |
| 84 | Great Neck | 11,087 | $1,455,882 | 0.2% | 2.2% |
| 85 | West Haverstraw | 10,711 | $425,896 | 0.5% | -0.9% |
| 86 | Canandaigua | 10,514 | $274,506 | -0.3% | -0.4% |
| 87 | Fredonia | 9,467 | $204,762 | -1.4% | -2.0% |
| 88 | Ogdensburg | 9,455 | $106,454 | -1.5% | -4.5% |
| 89 | Corning | 10,643 | $189,793 | -0.2% | 1.4% |
| 90 | Woodbury | 11,334 | $1,478,907 | -0.9% | 2.5% |
| 91 | Oneida | 10,171 | $209,145 | -0.7% | 0.4% |
| 92 | Suffern | 11,441 | $576,039 | 0.4% | 1.2% |
| 93 | Mount Kisco | 10,737 | $688,450 | -0.4% | 0.4% |
| 94 | Dobbs Ferry | 11,443 | $975,067 | 0.4% | 1.7% |
| 95 | Lake Grove | 11,061 | $713,789 | 0.1% | 1.4% |
| 96 | Fulton | 11,272 | $175,606 | -0.6% | -0.3% |
| 97 | Tarr | 11,784 | $821,121 | 0.3% | 1.7% |
| 98 | Dunkirk | 12,549 | $128,151 | -0.4% | -1.8% |
| 99 | Babylon | 12,185 | $720,475 | 0.0% | -0.5% |
| 100 | Haverstraw | 12,325 | $444,472 | 0.4% | -1.1% |