Editor’s Note: This is not investment advice, and we are not financial advisers.
Suppose real estate is the most significant investment a majority of people make in their lifetime. In that case, it’s best to understand the places in South Carolina with best potential return on investment.
After working in real estate adjacent roles for over a decade, I had the hypothesis that the best place to buy for a return on investment would be up-and-coming cities. Smaller cities where crime might be high now, but people still move to.
To test my hypothesis, we are going to look at places in South Carolina that are growing faster than average, but where home prices are below average, and crime rates are higher than average.
In everyday terms, these might be “deals”. The best deal in South Carolina at the moment according to Saturday Night Science? That would be Lyman.
3.6% population growth · -0.7% home price growth
Data | Crime | Cost of living | Movers
7.9% population growth · -1.3% home price growth
Data | Crime | Cost of living | Movers
1.0% population growth · -0.1% home price growth
Data | Crime | Cost of living | Movers
0.4% population growth · 1.3% home price growth
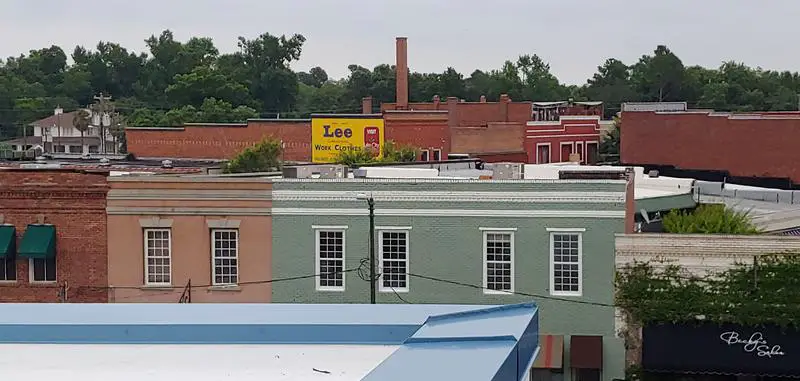
Central is a town in Pickens County, South Carolina, United States. As of the 2010 census, the population was 5,159, roughly 3,000 of which were considered permanent residents. Contrary to its name, it is not near the center of South Carolina. It received its name from its geographic location, being the halfway or central point between Atlanta and Charlotte along the former Atlanta and Richmond Air-Line Railway line. The primary campus of Southern Wesleyan University is located east of the downtown area.
Data | Crime | Cost of living | Movers
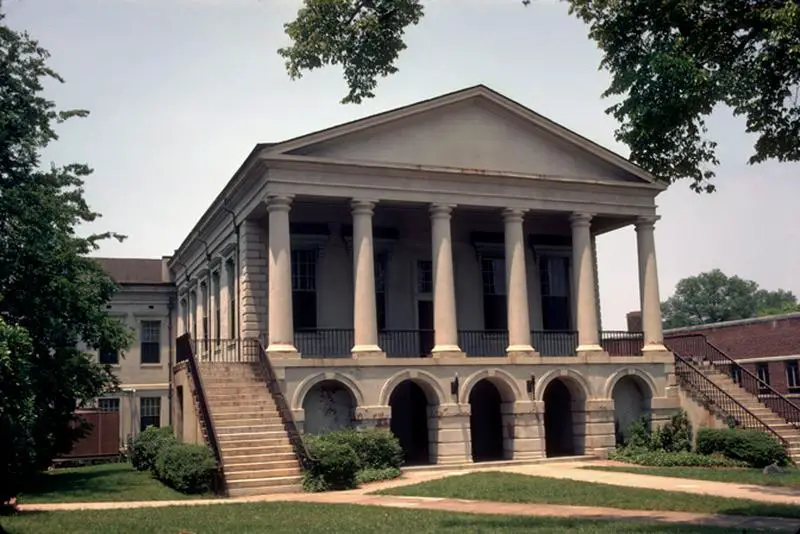
-0.4% population growth · 1.5% home price growth
Chester is a small rural city in Chester County, South Carolina, United States. The population was 5,607 at the 2010 census, down from 6,476 at the 2000 census. It is the county seat of Chester County.
Data | Crime | Cost of living | Movers
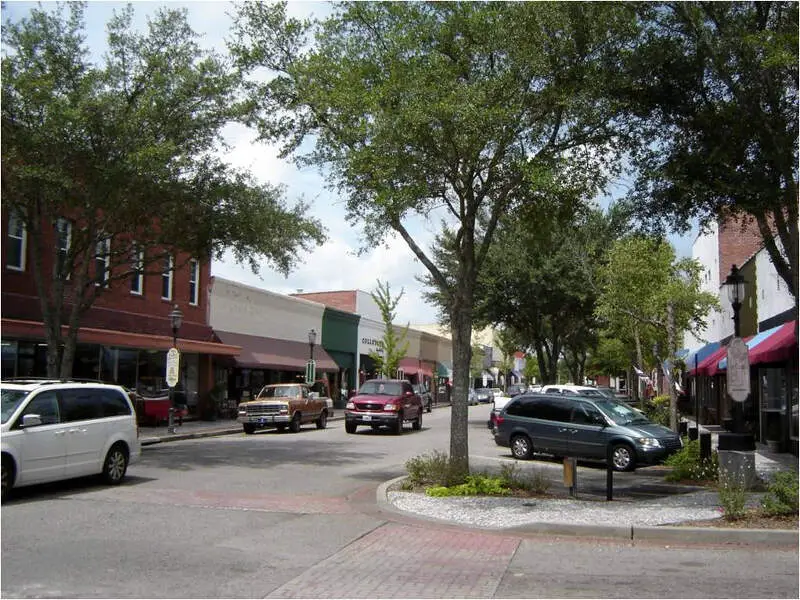
-0.2% population growth · -1.0% home price growth
Walterboro is a city in Colleton County, South Carolina, United States. The population was 5,398 at the 2010 census. It is the county seat of Colleton County. Walterboro is located 48 miles west of Charleston and is located near the ACE Basin region in the South Carolina Lowcountry.
Data | Crime | Cost of living | Movers
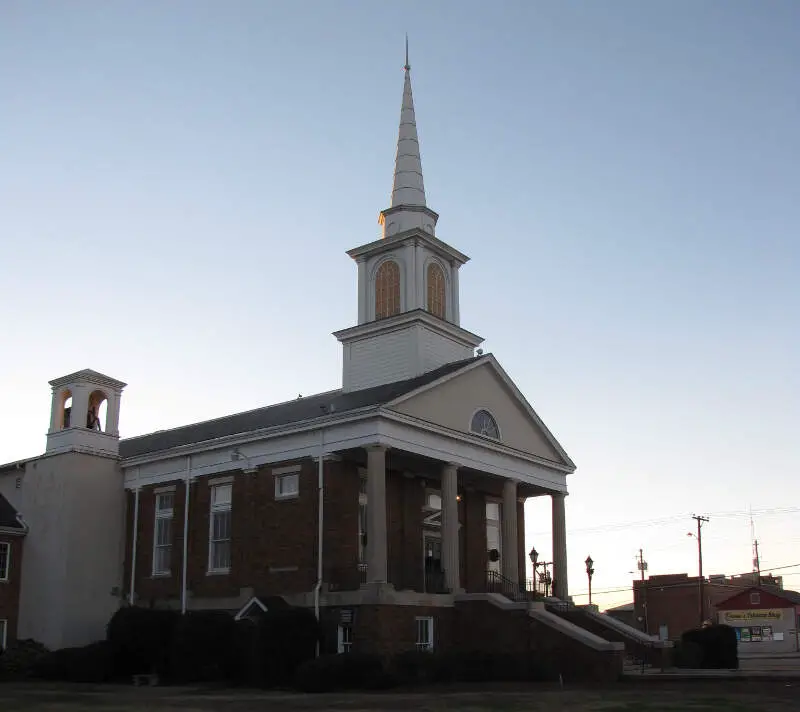
-0.1% population growth · 7.4% home price growth
Darlington is a city located in Darlington County, South Carolina, United States. In 2016, its population was 6,117. It is the county seat of Darlington County. It is part of the Florence, South Carolina Metropolitan Statistical Area.
Data | Crime | Cost of living | Movers
-0.8% population growth · -3.5% home price growth
Data | Crime | Cost of living | Movers
3.2% population growth · -0.1% home price growth
Clover is a town in York County, South Carolina, United States located in the greater Charlotte, North Carolina, metropolitan area. As of 2010, the population was at 5,094 within the town limits. Clover is twinned with the Northern Irish town of Larne on County Antrim’s East Coast.
Data | Crime | Cost of living | Movers
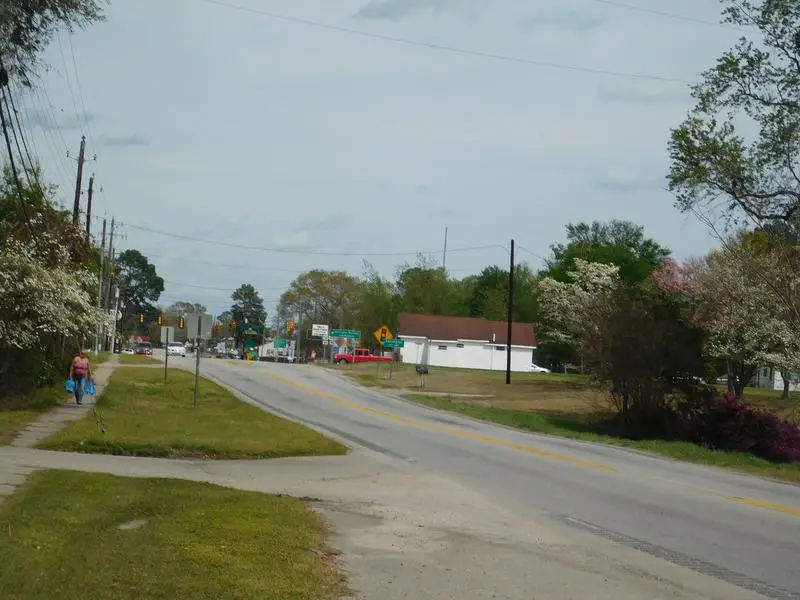
-0.7% population growth · 3.2% home price growth
Lake City is a city in Florence County, South Carolina, United States. The population was 6,675 at the 2010 census. Located in central South Carolina, it is south of Florence and included as part of the Florence Metropolitan Statistical Area.
Data | Crime | Cost of living | Movers
The receipts
Compare the top ten
Pick a metric. The bars rescale. The red line is South Carolina’s statewide median.
South Carolina statewide median: $304,083
On the map
Where South Carolina’s best buys are
Saturday Night Science
Methodology: How do you determine the best places to buy a home in South Carolina for 2026?
We were in real estate for almost five years and have worked on this site for over a decade. Suffice it to say we’ve put a lot of thought into finding an excellent place to buy a home.
So all that thinking has come to this moment where we get to spell out how we’d approach finding an up-and-coming place to live in South Carolina. Put differently, the analysis will try to find places in South Carolina with undervalued homes relative to pent-up demand using Saturday Night Science.
To do that, we looked at the most recent American Community Survey Census data for 2020-2024 and compared it to the previous vintage. Specifically, we used the following criteria:
- Y-o-Y Change In Population (People want to live here)
- Y-o-Y Change In Median Home Prices (People are willing to pay for it)
- Home Prices Relative To The State Average (It’s still kinda cheap)
We want places that are growing, have seen home prices increase in recent years, and are still “cheap” for South Carolina, with these caveats: home prices had to be within 20% of the state average, home prices increased in the last year, and the city had above 5,000 people.
So of the 394 cities and towns in South Carolina, only 64 places made it through our initial filters to even be considered.
We then ranked each place from 1 to 64 for the above criteria, with 1 being the best. We averaged the rankings to create a “best place to buy” index, with the place having the lowest index being the best.
Turns out that Lyman is the best potential gem in the not-so-rough in the Palmetto State.
The full plate
Best Places To Buy A Home In South Carolina
Click any column to sort. Search by city name.
| Rank | City | Population | Median Home Price | Population Change | Home Price Increase |
|---|---|---|---|---|---|
| 1 | Lyman | 6,547 | $303,651 | 3.6% | -0.7% |
| 2 | Blythewood | 5,731 | $340,026 | 7.9% | -1.3% |
| 3 | Hollywood | 5,382 | $519,343 | 1.0% | -0.1% |
| 4 | Central | 5,320 | $284,221 | 0.4% | 1.3% |
| 5 | Chester | 5,218 | $128,680 | -0.4% | 1.5% |
| 6 | Walterboro | 5,480 | $210,403 | -0.2% | -1.0% |
| 7 | Darlington | 6,120 | $153,323 | -0.1% | 7.4% |
| 8 | Dillon | 6,354 | $100,984 | -0.8% | -3.5% |
| 9 | Clover | 7,234 | $413,528 | 3.2% | -0.1% |
| 10 | Lake City | 5,988 | $126,633 | -0.7% | 3.2% |
| 11 | Marion | 6,206 | $145,563 | -2.1% | 18.8% |
| 12 | Hardeeville | 10,871 | $426,445 | 17.0% | -6.9% |
| 13 | Camden | 8,267 | $237,603 | 3.0% | 0.3% |
| 14 | Hartsville | 7,419 | $179,199 | -0.0% | 5.3% |
| 15 | Union | 8,079 | $136,356 | 0.4% | 8.9% |
| 16 | Bennettsville | 7,751 | $81,007 | 14.0% | -18.8% |
| 17 | Travelers Rest | 8,370 | $353,916 | 2.9% | 2.5% |
| 18 | York | 8,969 | $356,169 | 3.1% | 0.2% |
| 19 | Clinton | 7,676 | $163,866 | 0.7% | 4.2% |
| 20 | Seneca | 8,993 | $304,236 | 0.9% | 1.8% |
| 21 | Laurens | 9,336 | $180,131 | 0.3% | 3.6% |
| 22 | Georgetown | 8,565 | $250,504 | 0.6% | 3.1% |
| 23 | Lancaster | 8,921 | $291,062 | 2.1% | 4.6% |
| 24 | Fountain Inn | 12,020 | $305,626 | 6.3% | -0.3% |
| 25 | Newberry | 10,790 | $166,455 | 0.5% | 3.4% |
| 26 | Forest Acres | 10,530 | $335,524 | 0.4% | 3.9% |
| 27 | Tega Cay | 13,615 | $611,048 | 2.6% | 1.0% |
| 28 | Moncks Corner | 15,485 | $360,391 | 7.8% | -0.2% |
| 29 | James Island | 12,198 | $597,131 | 3.9% | 2.9% |
| 30 | Irmo | 11,813 | $281,255 | 0.1% | 0.1% |
| 31 | Orangeburg | 13,253 | $162,436 | 0.5% | 0.7% |
| 32 | Gaffney | 12,596 | $185,841 | -0.1% | 2.1% |
| 33 | Port Royal | 15,579 | $355,157 | 3.5% | 2.3% |
| 34 | Beaufort | 13,747 | $412,456 | 0.6% | 1.1% |
| 35 | Cayce | 13,741 | $210,165 | 0.2% | 2.0% |
| 36 | North Myrtle Beach | 19,855 | $390,621 | 2.6% | 0.6% |
| 37 | Clemson | 18,072 | $396,341 | 1.8% | -2.1% |
| 38 | West Columbia | 17,963 | $226,049 | 1.4% | 2.2% |
| 39 | Fort Mill | 30,775 | $527,208 | 8.8% | -0.5% |
| 40 | Easley | 24,841 | $315,980 | 3.8% | -0.3% |
| 41 | Lexington | 24,585 | $303,204 | 1.9% | 0.1% |
| 42 | Bluffton | 33,157 | $498,492 | 5.9% | -0.4% |
| 43 | Simpsonville | 26,144 | $377,970 | 4.1% | 0.9% |
| 44 | Greenwood | 22,536 | $183,963 | 0.0% | 0.4% |
| 45 | North Augusta | 25,653 | $265,723 | 2.9% | 3.3% |
| 46 | Conway | 27,263 | $286,177 | 4.5% | -0.5% |
| 47 | Hanahan | 21,452 | $404,452 | 1.6% | -0.7% |
| 48 | Mauldin | 27,055 | $297,318 | 4.1% | 1.7% |
| 49 | Anderson | 30,051 | $272,108 | 1.7% | 1.6% |
| 50 | Aiken | 32,521 | $272,072 | 0.6% | 3.0% |
| 51 | Greer | 41,536 | $348,460 | 6.0% | -0.2% |
| 52 | Myrtle Beach | 38,371 | $320,925 | 3.1% | 0.7% |
| 53 | Spartanburg | 38,910 | $233,687 | 0.9% | 2.5% |
| 54 | Florence | 40,408 | $219,285 | 0.5% | 0.1% |
| 55 | Sumter | 43,053 | $213,463 | -0.0% | 1.7% |
| 56 | Hilton Head Island | 37,911 | $787,679 | 0.3% | 2.4% |
| 57 | Goose Creek | 48,078 | $318,055 | 2.4% | 0.0% |
| 58 | Summerville | 51,654 | $376,903 | 0.8% | -1.1% |
| 59 | Greenville | 72,935 | $327,592 | 1.6% | 1.0% |
| 60 | Rock Hill | 75,259 | $326,184 | 0.7% | -0.6% |
| 61 | Mount Pleasant | 93,993 | $875,092 | 1.4% | 1.7% |
| 62 | North Charleston | 119,913 | $309,522 | 2.1% | -0.5% |
| 63 | Columbia | 139,643 | $229,068 | 1.2% | 1.4% |
| 64 | Charleston | 154,338 | $589,607 | 1.5% | 1.7% |
Source: U.S. Census ACS 2020-2024 via Saturday Night Science. 64 South Carolina cities cleared the filters.
Summary
Summary: The Best Places To Purchase A House In South Carolina for 2026
There’s our analysis of the best places to buy a house in South Carolina. And, to be clear, we aren’t necessarily saying these places are the best places to live, just that it looks like they might be in a couple of years based on the data.
In fact, every place in the following table meets our criteria, so even though it may not look super long, remember we started off with all 394 places in the state.
The best cities to buy a house in South Carolina are Lyman, Blythewood, Hollywood, Central, Chester, Walterboro, Darlington, Dillon, Clover, and Lake City.
So if we could rent or buy in these cities, we’d definitely buy.