Fort Collins, CO
Demographics And Statistics
Living In Fort Collins, Colorado Summary
Life in Fort Collins research summary. HomeSnacks has been using Saturday Night Science to research the quality of life in Fort Collins over the past nine years using Census, FBI, Zillow, and other primary data sources. Based on the most recently available data, we found the following about life in Fort Collins:
The population in Fort Collins is 169,705.
The median home value in Fort Collins is $554,176.
The median income in Fort Collins is $83,598.
The cost of living in Fort Collins is 126 which is 1.3x higher than the national average.
The median rent in Fort Collins is $1,661.
The unemployment rate in Fort Collins is 5.2%.
The poverty rate in Fort Collins is 16.0%.
The average high in Fort Collins is 60.4° and the average low is 32.9°.
Fort Collins SnackAbility
Overall SnackAbility
Fort Collins, CO Crime Report
Crime in Fort Collins summary. We use data from the FBI to determine the crime rates in Fort Collins. Key points include:
There were 4,140 total crimes in Fort Collins in the last reporting year.
The overall crime rate per 100,000 people in Fort Collins is 2,428.0 / 100k people.
The violent crime rate per 100,000 people in Fort Collins is 272.7 / 100k people.
The property crime rate per 100,000 people in Fort Collins is 2,155.3 / 100k people.
Overall, crime in Fort Collins is 14.57% above the national average.
Total Crimes
Above National Average
Crime In Fort Collins Comparison Table
| Statistic | Count Raw |
Fort Collins / 100k People |
Colorado / 100k People |
National / 100k People |
|---|---|---|---|---|
| Total Crimes Per 100K | 4,140 | 2,428.0 | 3,069.1 | 2,119.2 |
| Violent Crime | 465 | 272.7 | 476.3 | 359.0 |
| Murder | 3 | 1.8 | 4.5 | 5.0 |
| Robbery | 42 | 24.6 | 63.0 | 61.0 |
| Aggravated Assault | 381 | 223.4 | 350.5 | 256.0 |
| Property Crime | 3,675 | 2,155.3 | 2,592.8 | 1,760.0 |
| Burglary | 390 | 228.7 | 348.0 | 229.0 |
| Larceny | 2,971 | 1,742.4 | 1,754.2 | 1,272.0 |
| Car Theft | 314 | 184.2 | 490.6 | 259.0 |
Fort Collins, CO Cost Of Living
Cost of living in Fort Collins summary. We use data on the cost of living to determine how expensive it is to live in Fort Collins. Real estate prices drive most of the variance in cost of living around Colorado. Key points include:
The cost of living in Fort Collins is 126 with 100 being average.
The cost of living in Fort Collins is 1.3x higher than the national average.
The median home value in Fort Collins is $554,176.
The median income in Fort Collins is $83,598.
Fort Collins's Overall Cost Of Living
Higher Than The National Average
Cost Of Living In Fort Collins Comparison Table
| Living Expense | Fort Collins | Colorado | National Average | |
|---|---|---|---|---|
| Overall | 126 | 111 | 100 | |
| Services | 101 | 102 | 100 | |
| Groceries | 104 | 103 | 100 | |
| Health | 102 | 101 | 100 | |
| Housing | 195 | 134 | 100 | |
| Transportation | 98 | 107 | 100 | |
| Utilities | 88 | 89 | 100 | |
Fort Collins, CO Weather
The average high in Fort Collins is 60.4° and the average low is 32.9°.
There are 40.0 days of precipitation each year.
Expect an average of 16.7 inches of precipitation each year with 71.2 inches of snow.
| Stat | Fort Collins |
|---|---|
| Average Annual High | 60.4 |
| Average Annual Low | 32.9 |
| Annual Precipitation Days | 40.0 |
| Average Annual Precipitation | 16.7 |
| Average Annual Snowfall | 71.2 |
Average High
Days of Rain
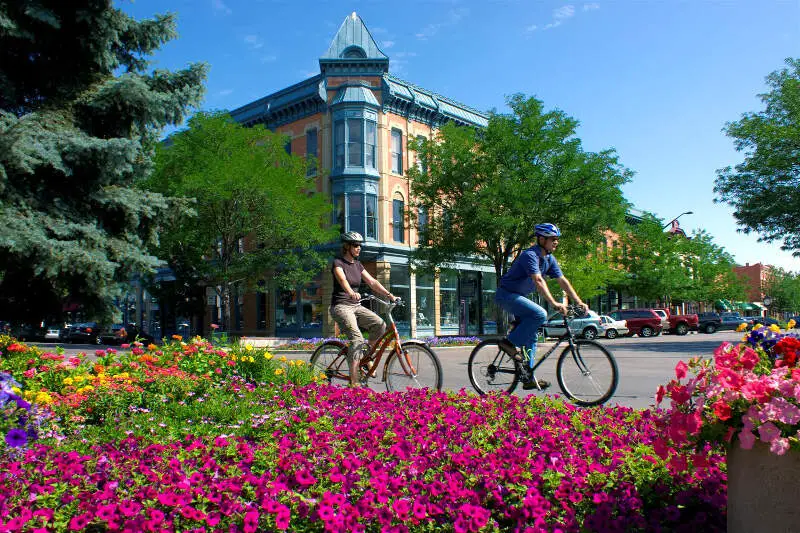
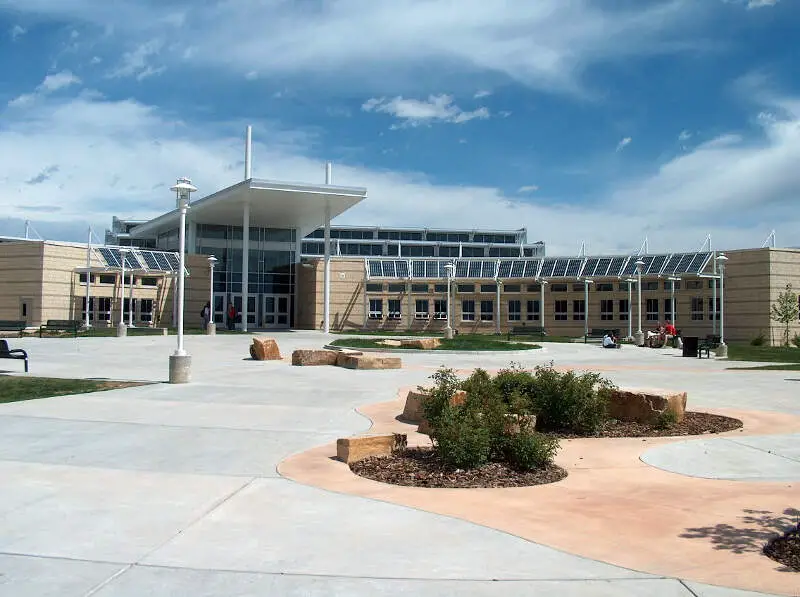
Fort Collins, CO Photos


2 Reviews & Comments About Fort Collins
/5

HomeSnacks User - 2018-08-04 23:28:32.867487
LOW CRIME AND VERY PRESTIGIOUS SCHOOLS
SO MANY THINGS TO DO OUTDOORS. THE WEATHER IS NOT HUMID, WHICH I LOVE. THE PEOPLE ARE SO FRIENDLY.
HomeSnacks User - 2018-08-05 13:00:23.716425
crime in relatively low. the school system is top class.
so many things to do and the friendly people.
Rankings for Fort Collins in Colorado


Locations Around Fort Collins
Map Of Fort Collins, CO
Best Places Around Fort Collins
Greeley, CO
Population 109,421
Windsor, CO
Population 35,918
Milliken, CO
Population 8,695
Loveland, CO
Population 77,350
Berthoud, CO
Population 11,684
Wellington, CO
Population 11,538
Johnstown, NY
Population 8,153
Fort Collins Demographics And Statistics
Population over time in Fort Collins
The current population in Fort Collins is 169,705. The population has increased 21.1% from 2010.
| Year | Population | % Change |
|---|---|---|
| 2023 | 169,705 | 0.6% |
| 2022 | 168,758 | 1.2% |
| 2021 | 166,788 | 0.4% |
| 2020 | 166,069 | 0.3% |
| 2019 | 165,609 | 1.9% |
| 2018 | 162,511 | 2.1% |
| 2017 | 159,150 | 1.2% |
| 2016 | 157,251 | 2.6% |
| 2015 | 153,292 | 2.4% |
| 2014 | 149,627 | 1.9% |
| 2013 | 146,822 | 1.7% |
| 2012 | 144,329 | 1.4% |
| 2011 | 142,332 | 1.6% |
| 2010 | 140,082 | - |
Race / Ethnicity in Fort Collins
Fort Collins is:
77.8% White with 132,109 White residents.
1.2% African American with 2,006 African American residents.
0.4% American Indian with 605 American Indian residents.
3.3% Asian with 5,539 Asian residents.
0.1% Hawaiian with 190 Hawaiian residents.
0.5% Other with 928 Other residents.
4.4% Two Or More with 7,385 Two Or More residents.
12.3% Hispanic with 20,943 Hispanic residents.
| Race | Fort Collins | CO | USA |
|---|---|---|---|
| White | 77.8% | 65.7% | 58.2% |
| African American | 1.2% | 3.8% | 12.0% |
| American Indian | 0.4% | 0.4% | 0.5% |
| Asian | 3.3% | 3.2% | 5.7% |
| Hawaiian | 0.1% | 0.1% | 0.2% |
| Other | 0.5% | 0.4% | 0.5% |
| Two Or More | 4.4% | 4.2% | 3.9% |
| Hispanic | 12.3% | 22.2% | 19.0% |
Gender in Fort Collins
Fort Collins is 50.1% female with 85,019 female residents.
Fort Collins is 49.9% male with 84,686 male residents.
| Gender | Fort Collins | CO | USA |
|---|---|---|---|
| Female | 50.1% | 49.4% | 50.5% |
| Male | 49.9% | 50.6% | 49.5% |
Highest level of educational attainment in Fort Collins for adults over 25
-0.0% of adults in Fort Collins completed < 9th grade.
2.0% of adults in Fort Collins completed 9-12th grade.
14.0% of adults in Fort Collins completed high school / ged.
16.0% of adults in Fort Collins completed some college.
8.0% of adults in Fort Collins completed associate's degree.
34.0% of adults in Fort Collins completed bachelor's degree.
19.0% of adults in Fort Collins completed master's degree.
3.0% of adults in Fort Collins completed professional degree.
4.0% of adults in Fort Collins completed doctorate degree.
| Education | Fort Collins | CO | USA |
|---|---|---|---|
| < 9th Grade | -0.0% | 2.0% | 5.0% |
| 9-12th Grade | 2.0% | 4.0% | 6.0% |
| High School / GED | 14.0% | 20.0% | 26.0% |
| Some College | 16.0% | 20.0% | 19.0% |
| Associate's Degree | 8.0% | 8.0% | 9.0% |
| Bachelor's Degree | 34.0% | 28.0% | 21.0% |
| Master's Degree | 19.0% | 13.0% | 10.0% |
| Professional Degree | 3.0% | 3.0% | 2.0% |
| Doctorate Degree | 4.0% | 2.0% | 2.0% |
Household Income For Fort Collins, Colorado
6.5% of households in Fort Collins earn Less than $10,000.
3.0% of households in Fort Collins earn $10,000 to $14,999.
5.7% of households in Fort Collins earn $15,000 to $24,999.
5.5% of households in Fort Collins earn $25,000 to $34,999.
10.0% of households in Fort Collins earn $35,000 to $49,999.
14.9% of households in Fort Collins earn $50,000 to $74,999.
12.5% of households in Fort Collins earn $75,000 to $99,999.
18.4% of households in Fort Collins earn $100,000 to $149,999.
10.3% of households in Fort Collins earn $150,000 to $199,999.
13.2% of households in Fort Collins earn $200,000 or more.
| Income | Fort Collins | CO | USA |
|---|---|---|---|
| Less than $10,000 | 6.5% | 3.9% | 4.9% |
| $10,000 to $14,999 | 3.0% | 2.6% | 3.6% |
| $15,000 to $24,999 | 5.7% | 5.0% | 6.6% |
| $25,000 to $34,999 | 5.5% | 5.3% | 6.8% |
| $35,000 to $49,999 | 10.0% | 8.9% | 10.4% |
| $50,000 to $74,999 | 14.9% | 15.0% | 15.7% |
| $75,000 to $99,999 | 12.5% | 13.0% | 12.7% |
| $100,000 to $149,999 | 18.4% | 19.3% | 17.4% |
| $150,000 to $199,999 | 10.3% | 11.3% | 9.3% |
| $200,000 or more | 13.2% | 15.8% | 12.6% |


