Lochbuie, CO
Demographics And Statistics
Living In Lochbuie, Colorado Summary
Life in Lochbuie research summary. HomeSnacks has been using Saturday Night Science to research the quality of life in Lochbuie over the past nine years using Census, FBI, Zillow, and other primary data sources. Based on the most recently available data, we found the following about life in Lochbuie:
The population in Lochbuie is 8,142.
The median home value in Lochbuie is $471,433.
The median income in Lochbuie is $88,548.
The cost of living in Lochbuie is 112 which is 1.1x higher than the national average.
The median rent in Lochbuie is $1,609.
The unemployment rate in Lochbuie is 1.1%.
The poverty rate in Lochbuie is 2.4%.
The average high in Lochbuie is 64.5° and the average low is 34.1°.
Table Of Contents
Lochbuie SnackAbility
Overall SnackAbility
Lochbuie, CO Cost Of Living
Cost of living in Lochbuie summary. We use data on the cost of living to determine how expensive it is to live in Lochbuie. Real estate prices drive most of the variance in cost of living around Colorado. Key points include:
The cost of living in Lochbuie is 112 with 100 being average.
The cost of living in Lochbuie is 1.1x higher than the national average.
The median home value in Lochbuie is $471,433.
The median income in Lochbuie is $88,548.
Lochbuie's Overall Cost Of Living
Higher Than The National Average
Cost Of Living In Lochbuie Comparison Table
| Living Expense | Lochbuie | Colorado | National Average | |
|---|---|---|---|---|
| Overall | 112 | 111 | 100 | |
| Services | 105 | 102 | 100 | |
| Groceries | 96 | 103 | 100 | |
| Health | 89 | 101 | 100 | |
| Housing | 143 | 134 | 100 | |
| Transportation | 110 | 107 | 100 | |
| Utilities | 86 | 89 | 100 | |
Lochbuie, CO Weather
The average high in Lochbuie is 64.5° and the average low is 34.1°.
There are 36.0 days of precipitation each year.
Expect an average of 14.0 inches of precipitation each year with 37.9 inches of snow.
| Stat | Lochbuie |
|---|---|
| Average Annual High | 64.5 |
| Average Annual Low | 34.1 |
| Annual Precipitation Days | 36.0 |
| Average Annual Precipitation | 14.0 |
| Average Annual Snowfall | 37.9 |
Average High
Days of Rain
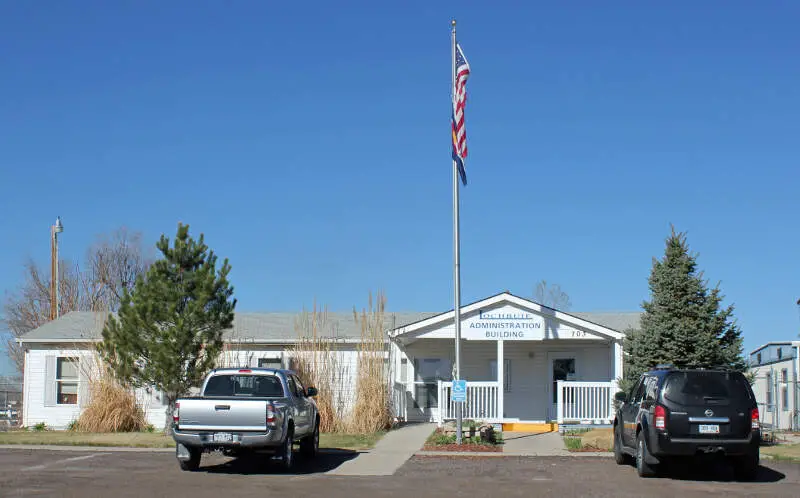
Lochbuie, CO Photos
1 Reviews & Comments About Lochbuie
/5

HomeSnacks User - 2019-05-01 22:03:40.635573
For some reason this site reviewed our awesome town as "#1 worst place in Colorado to live for 2019". These people obviously haven't been here lately. Median home values have skyrocketed over the last 5 years. We have real growth happening in our community. Also, we are a simple 25 minute drive to access all of the fun Denver and Colorado has for many downtown art, sport, food and outdoor activities. We are still a 0 stoplight town, but we have growing diversity and community connections happening throughout our community. Now, if this keeps more people from moving here, we love the quiet, but our little town is big on heart and great people.
The RE3J school district is one of the best we have ever had the benefit to have our kids a part of.
Rankings for Lochbuie in Colorado


Locations Around Lochbuie
Map Of Lochbuie, CO
Best Places Around Lochbuie
Federal Heights, CO
Population 14,160
Fort Lupton, CO
Population 8,494
Commerce, GA
Population 7,684
Welby, CO
Population 16,232
Sherrelwood, CO
Population 19,368
Denver, CO
Population 713,734
Firestone, CO
Population 17,353
Brighton, CO
Population 41,196
Northglenn, CO
Population 37,953
Frederick, CO
Population 15,893
Lochbuie Demographics And Statistics
Population over time in Lochbuie
The current population in Lochbuie is 8,142. The population has increased 89.1% from 2010.
| Year | Population | % Change |
|---|---|---|
| 2023 | 8,142 | 2.2% |
| 2022 | 7,963 | 3.0% |
| 2021 | 7,730 | 13.8% |
| 2020 | 6,795 | 6.4% |
| 2019 | 6,388 | 5.8% |
| 2018 | 6,036 | 6.4% |
| 2017 | 5,675 | 5.7% |
| 2016 | 5,367 | 2.8% |
| 2015 | 5,222 | 1.9% |
| 2014 | 5,127 | 3.6% |
| 2013 | 4,947 | 3.1% |
| 2012 | 4,799 | 6.2% |
| 2011 | 4,517 | 4.9% |
| 2010 | 4,306 | - |
Race / Ethnicity in Lochbuie
Lochbuie is:
44.2% White with 3,595 White residents.
4.3% African American with 354 African American residents.
0.8% American Indian with 65 American Indian residents.
0.0% Asian with 0 Asian residents.
0.0% Hawaiian with 0 Hawaiian residents.
0.8% Other with 62 Other residents.
0.4% Two Or More with 30 Two Or More residents.
49.6% Hispanic with 4,036 Hispanic residents.
| Race | Lochbuie | CO | USA |
|---|---|---|---|
| White | 44.2% | 65.7% | 58.2% |
| African American | 4.3% | 3.8% | 12.0% |
| American Indian | 0.8% | 0.4% | 0.5% |
| Asian | 0.0% | 3.2% | 5.7% |
| Hawaiian | 0.0% | 0.1% | 0.2% |
| Other | 0.8% | 0.4% | 0.5% |
| Two Or More | 0.4% | 4.2% | 3.9% |
| Hispanic | 49.6% | 22.2% | 19.0% |
Gender in Lochbuie
Lochbuie is 50.5% female with 4,109 female residents.
Lochbuie is 49.5% male with 4,033 male residents.
| Gender | Lochbuie | CO | USA |
|---|---|---|---|
| Female | 50.5% | 49.4% | 50.5% |
| Male | 49.5% | 50.6% | 49.5% |
Highest level of educational attainment in Lochbuie for adults over 25
11.0% of adults in Lochbuie completed < 9th grade.
7.0% of adults in Lochbuie completed 9-12th grade.
31.0% of adults in Lochbuie completed high school / ged.
24.0% of adults in Lochbuie completed some college.
11.0% of adults in Lochbuie completed associate's degree.
12.0% of adults in Lochbuie completed bachelor's degree.
4.0% of adults in Lochbuie completed master's degree.
0.0% of adults in Lochbuie completed professional degree.
0.0% of adults in Lochbuie completed doctorate degree.
| Education | Lochbuie | CO | USA |
|---|---|---|---|
| < 9th Grade | 11.0% | 2.0% | 5.0% |
| 9-12th Grade | 7.0% | 4.0% | 6.0% |
| High School / GED | 31.0% | 20.0% | 26.0% |
| Some College | 24.0% | 20.0% | 19.0% |
| Associate's Degree | 11.0% | 8.0% | 9.0% |
| Bachelor's Degree | 12.0% | 28.0% | 21.0% |
| Master's Degree | 4.0% | 13.0% | 10.0% |
| Professional Degree | 0.0% | 3.0% | 2.0% |
| Doctorate Degree | 0.0% | 2.0% | 2.0% |
Household Income For Lochbuie, Colorado
4.1% of households in Lochbuie earn Less than $10,000.
0.0% of households in Lochbuie earn $10,000 to $14,999.
0.5% of households in Lochbuie earn $15,000 to $24,999.
2.8% of households in Lochbuie earn $25,000 to $34,999.
9.0% of households in Lochbuie earn $35,000 to $49,999.
20.7% of households in Lochbuie earn $50,000 to $74,999.
20.6% of households in Lochbuie earn $75,000 to $99,999.
34.9% of households in Lochbuie earn $100,000 to $149,999.
6.6% of households in Lochbuie earn $150,000 to $199,999.
0.8% of households in Lochbuie earn $200,000 or more.
| Income | Lochbuie | CO | USA |
|---|---|---|---|
| Less than $10,000 | 4.1% | 3.9% | 4.9% |
| $10,000 to $14,999 | 0.0% | 2.6% | 3.6% |
| $15,000 to $24,999 | 0.5% | 5.0% | 6.6% |
| $25,000 to $34,999 | 2.8% | 5.3% | 6.8% |
| $35,000 to $49,999 | 9.0% | 8.9% | 10.4% |
| $50,000 to $74,999 | 20.7% | 15.0% | 15.7% |
| $75,000 to $99,999 | 20.6% | 13.0% | 12.7% |
| $100,000 to $149,999 | 34.9% | 19.3% | 17.4% |
| $150,000 to $199,999 | 6.6% | 11.3% | 9.3% |
| $200,000 or more | 0.8% | 15.8% | 12.6% |


