Longmont, CO
Demographics And Statistics
Living In Longmont, Colorado Summary
Life in Longmont research summary. HomeSnacks has been using Saturday Night Science to research the quality of life in Longmont over the past nine years using Census, FBI, Zillow, and other primary data sources. Based on the most recently available data, we found the following about life in Longmont:
The population in Longmont is 98,958.
The median home value in Longmont is $552,654.
The median income in Longmont is $89,724.
The cost of living in Longmont is 130 which is 1.3x higher than the national average.
The median rent in Longmont is $1,755.
The unemployment rate in Longmont is 4.3%.
The poverty rate in Longmont is 8.6%.
The average high in Longmont is 61.7° and the average low is 33.9°.
Longmont SnackAbility
Overall SnackAbility
Longmont, CO Crime Report
Crime in Longmont summary. We use data from the FBI to determine the crime rates in Longmont. Key points include:
There were 3,040 total crimes in Longmont in the last reporting year.
The overall crime rate per 100,000 people in Longmont is 3,088.0 / 100k people.
The violent crime rate per 100,000 people in Longmont is 469.3 / 100k people.
The property crime rate per 100,000 people in Longmont is 2,618.7 / 100k people.
Overall, crime in Longmont is 45.71% above the national average.
Total Crimes
Above National Average
Crime In Longmont Comparison Table
| Statistic | Count Raw |
Longmont / 100k People |
Colorado / 100k People |
National / 100k People |
|---|---|---|---|---|
| Total Crimes Per 100K | 3,040 | 3,088.0 | 3,069.1 | 2,119.2 |
| Violent Crime | 462 | 469.3 | 476.3 | 359.0 |
| Murder | 4 | 4.1 | 4.5 | 5.0 |
| Robbery | 31 | 31.5 | 63.0 | 61.0 |
| Aggravated Assault | 309 | 313.9 | 350.5 | 256.0 |
| Property Crime | 2,578 | 2,618.7 | 2,592.8 | 1,760.0 |
| Burglary | 219 | 222.5 | 348.0 | 229.0 |
| Larceny | 2,052 | 2,084.4 | 1,754.2 | 1,272.0 |
| Car Theft | 307 | 311.8 | 490.6 | 259.0 |
Longmont, CO Cost Of Living
Cost of living in Longmont summary. We use data on the cost of living to determine how expensive it is to live in Longmont. Real estate prices drive most of the variance in cost of living around Colorado. Key points include:
The cost of living in Longmont is 130 with 100 being average.
The cost of living in Longmont is 1.3x higher than the national average.
The median home value in Longmont is $552,654.
The median income in Longmont is $89,724.
Longmont's Overall Cost Of Living
Higher Than The National Average
Cost Of Living In Longmont Comparison Table
| Living Expense | Longmont | Colorado | National Average | |
|---|---|---|---|---|
| Overall | 130 | 111 | 100 | |
| Services | 104 | 102 | 100 | |
| Groceries | 97 | 103 | 100 | |
| Health | 90 | 101 | 100 | |
| Housing | 194 | 134 | 100 | |
| Transportation | 110 | 107 | 100 | |
| Utilities | 87 | 89 | 100 | |
Longmont, CO Weather
The average high in Longmont is 61.7° and the average low is 33.9°.
There are 46.6 days of precipitation each year.
Expect an average of 18.6 inches of precipitation each year with 88.7 inches of snow.
| Stat | Longmont |
|---|---|
| Average Annual High | 61.7 |
| Average Annual Low | 33.9 |
| Annual Precipitation Days | 46.6 |
| Average Annual Precipitation | 18.6 |
| Average Annual Snowfall | 88.7 |
Average High
Days of Rain
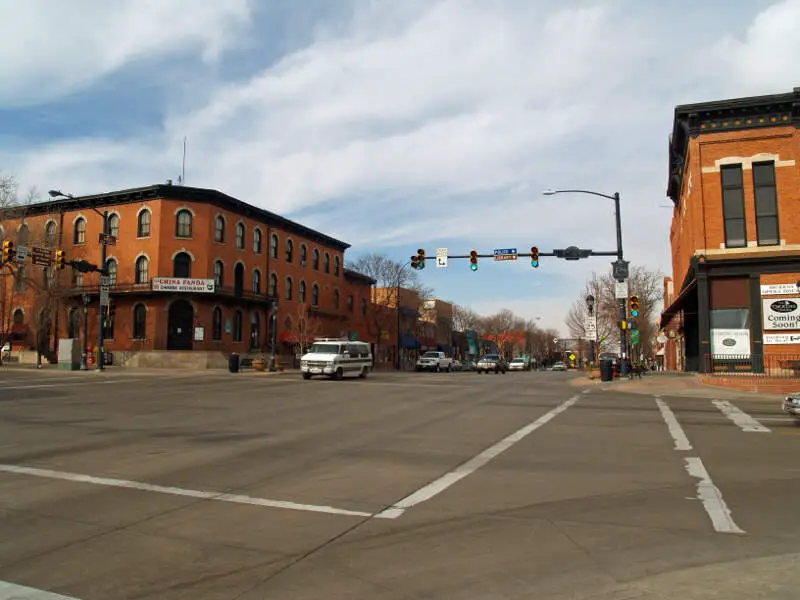
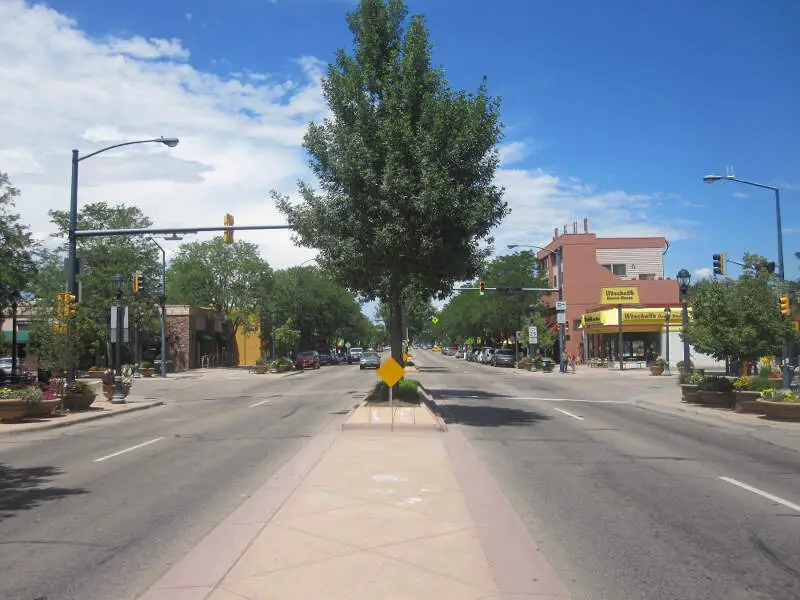
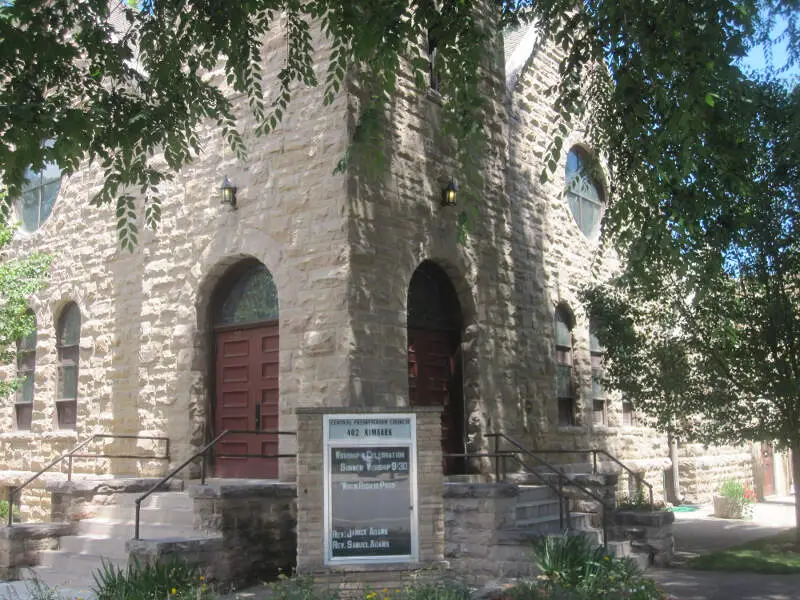
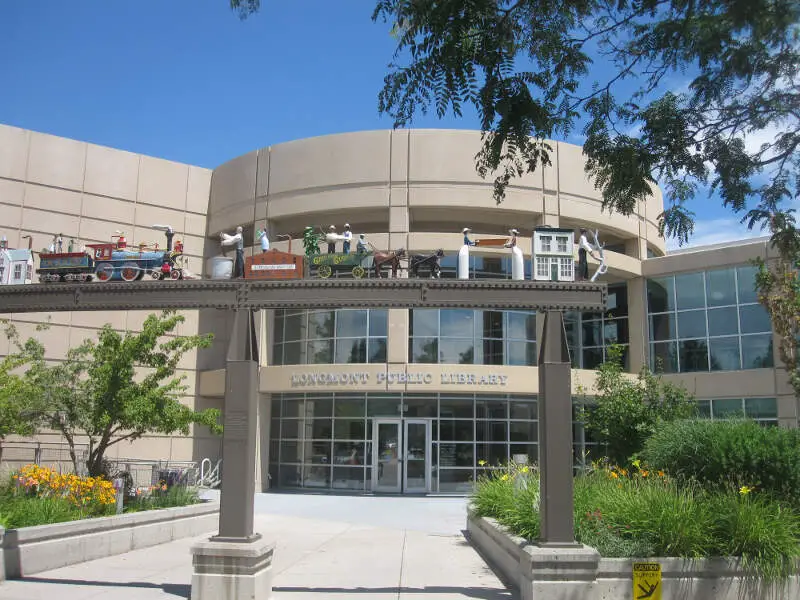
Longmont, CO Photos


Rankings for Longmont in Colorado


Locations Around Longmont
Map Of Longmont, CO
Best Places Around Longmont
Fort Lupton, CO
Population 8,494
Firestone, CO
Population 17,353
Milliken, CO
Population 8,695
Loveland, CO
Population 77,350
Northglenn, CO
Population 37,953
Frederick, CO
Population 15,893
Berthoud, CO
Population 11,684
Westminster, CO
Population 115,546
Thornton, CO
Population 142,878
Gunbarrel, CO
Population 10,424
Longmont Demographics And Statistics
Population over time in Longmont
The current population in Longmont is 98,958. The population has increased 18.4% from 2010.
| Year | Population | % Change |
|---|---|---|
| 2023 | 98,958 | 0.7% |
| 2022 | 98,282 | -0.5% |
| 2021 | 98,789 | 3.1% |
| 2020 | 95,864 | 1.5% |
| 2019 | 94,445 | 1.3% |
| 2018 | 93,244 | 1.7% |
| 2017 | 91,730 | 1.1% |
| 2016 | 90,719 | 1.0% |
| 2015 | 89,814 | 1.4% |
| 2014 | 88,547 | 1.1% |
| 2013 | 87,607 | 1.4% |
| 2012 | 86,355 | 1.5% |
| 2011 | 85,116 | 1.8% |
| 2010 | 83,604 | - |
Race / Ethnicity in Longmont
Longmont is:
67.5% White with 66,825 White residents.
0.9% African American with 858 African American residents.
0.2% American Indian with 191 American Indian residents.
2.9% Asian with 2,895 Asian residents.
0.1% Hawaiian with 89 Hawaiian residents.
0.1% Other with 145 Other residents.
4.0% Two Or More with 4,007 Two Or More residents.
24.2% Hispanic with 23,948 Hispanic residents.
| Race | Longmont | CO | USA |
|---|---|---|---|
| White | 67.5% | 65.7% | 58.2% |
| African American | 0.9% | 3.8% | 12.0% |
| American Indian | 0.2% | 0.4% | 0.5% |
| Asian | 2.9% | 3.2% | 5.7% |
| Hawaiian | 0.1% | 0.1% | 0.2% |
| Other | 0.1% | 0.4% | 0.5% |
| Two Or More | 4.0% | 4.2% | 3.9% |
| Hispanic | 24.2% | 22.2% | 19.0% |
Gender in Longmont
Longmont is 50.4% female with 49,882 female residents.
Longmont is 49.6% male with 49,076 male residents.
| Gender | Longmont | CO | USA |
|---|---|---|---|
| Female | 50.4% | 49.4% | 50.5% |
| Male | 49.6% | 50.6% | 49.5% |
Highest level of educational attainment in Longmont for adults over 25
4.0% of adults in Longmont completed < 9th grade.
4.0% of adults in Longmont completed 9-12th grade.
17.0% of adults in Longmont completed high school / ged.
20.0% of adults in Longmont completed some college.
8.0% of adults in Longmont completed associate's degree.
28.0% of adults in Longmont completed bachelor's degree.
14.0% of adults in Longmont completed master's degree.
2.0% of adults in Longmont completed professional degree.
3.0% of adults in Longmont completed doctorate degree.
| Education | Longmont | CO | USA |
|---|---|---|---|
| < 9th Grade | 4.0% | 2.0% | 5.0% |
| 9-12th Grade | 4.0% | 4.0% | 6.0% |
| High School / GED | 17.0% | 20.0% | 26.0% |
| Some College | 20.0% | 20.0% | 19.0% |
| Associate's Degree | 8.0% | 8.0% | 9.0% |
| Bachelor's Degree | 28.0% | 28.0% | 21.0% |
| Master's Degree | 14.0% | 13.0% | 10.0% |
| Professional Degree | 2.0% | 3.0% | 2.0% |
| Doctorate Degree | 3.0% | 2.0% | 2.0% |
Household Income For Longmont, Colorado
4.3% of households in Longmont earn Less than $10,000.
2.2% of households in Longmont earn $10,000 to $14,999.
5.5% of households in Longmont earn $15,000 to $24,999.
4.6% of households in Longmont earn $25,000 to $34,999.
9.1% of households in Longmont earn $35,000 to $49,999.
15.7% of households in Longmont earn $50,000 to $74,999.
13.5% of households in Longmont earn $75,000 to $99,999.
20.4% of households in Longmont earn $100,000 to $149,999.
10.8% of households in Longmont earn $150,000 to $199,999.
13.9% of households in Longmont earn $200,000 or more.
| Income | Longmont | CO | USA |
|---|---|---|---|
| Less than $10,000 | 4.3% | 3.9% | 4.9% |
| $10,000 to $14,999 | 2.2% | 2.6% | 3.6% |
| $15,000 to $24,999 | 5.5% | 5.0% | 6.6% |
| $25,000 to $34,999 | 4.6% | 5.3% | 6.8% |
| $35,000 to $49,999 | 9.1% | 8.9% | 10.4% |
| $50,000 to $74,999 | 15.7% | 15.0% | 15.7% |
| $75,000 to $99,999 | 13.5% | 13.0% | 12.7% |
| $100,000 to $149,999 | 20.4% | 19.3% | 17.4% |
| $150,000 to $199,999 | 10.8% | 11.3% | 9.3% |
| $200,000 or more | 13.9% | 15.8% | 12.6% |


