Parker, CO
Demographics And Statistics
Living In Parker, Colorado Summary
Life in Parker research summary. HomeSnacks has been using Saturday Night Science to research the quality of life in Parker over the past nine years using Census, FBI, Zillow, and other primary data sources. Based on the most recently available data, we found the following about life in Parker:
The population in Parker is 60,115.
The median home value in Parker is $686,864.
The median income in Parker is $129,342.
The cost of living in Parker is 140 which is 1.4x higher than the national average.
The median rent in Parker is $1,973.
The unemployment rate in Parker is 3.0%.
The poverty rate in Parker is 3.2%.
The average high in Parker is 63.2° and the average low is 34.3°.
Parker SnackAbility
Overall SnackAbility
Parker, CO Crime Report
Crime in Parker summary. We use data from the FBI to determine the crime rates in Parker. Key points include:
There were 1,190 total crimes in Parker in the last reporting year.
The overall crime rate per 100,000 people in Parker is 1,856.8 / 100k people.
The violent crime rate per 100,000 people in Parker is 209.1 / 100k people.
The property crime rate per 100,000 people in Parker is 1,647.7 / 100k people.
Overall, crime in Parker is -12.38% below the national average.
Total Crimes
Below National Average
Crime In Parker Comparison Table
| Statistic | Count Raw |
Parker / 100k People |
Colorado / 100k People |
National / 100k People |
|---|---|---|---|---|
| Total Crimes Per 100K | 1,190 | 1,856.8 | 3,069.1 | 2,119.2 |
| Violent Crime | 134 | 209.1 | 476.3 | 359.0 |
| Murder | 2 | 3.1 | 4.5 | 5.0 |
| Robbery | 7 | 10.9 | 63.0 | 61.0 |
| Aggravated Assault | 100 | 156.0 | 350.5 | 256.0 |
| Property Crime | 1,056 | 1,647.7 | 2,592.8 | 1,760.0 |
| Burglary | 119 | 185.7 | 348.0 | 229.0 |
| Larceny | 849 | 1,324.7 | 1,754.2 | 1,272.0 |
| Car Theft | 88 | 137.3 | 490.6 | 259.0 |
Parker, CO Cost Of Living
Cost of living in Parker summary. We use data on the cost of living to determine how expensive it is to live in Parker. Real estate prices drive most of the variance in cost of living around Colorado. Key points include:
The cost of living in Parker is 140 with 100 being average.
The cost of living in Parker is 1.4x higher than the national average.
The median home value in Parker is $686,864.
The median income in Parker is $129,342.
Parker's Overall Cost Of Living
Higher Than The National Average
Cost Of Living In Parker Comparison Table
| Living Expense | Parker | Colorado | National Average | |
|---|---|---|---|---|
| Overall | 140 | 111 | 100 | |
| Services | 105 | 102 | 100 | |
| Groceries | 106 | 103 | 100 | |
| Health | 100 | 101 | 100 | |
| Housing | 224 | 134 | 100 | |
| Transportation | 102 | 107 | 100 | |
| Utilities | 83 | 89 | 100 | |
Parker, CO Weather
The average high in Parker is 63.2° and the average low is 34.3°.
There are 45.1 days of precipitation each year.
Expect an average of 19.4 inches of precipitation each year with 73.6 inches of snow.
| Stat | Parker |
|---|---|
| Average Annual High | 63.2 |
| Average Annual Low | 34.3 |
| Annual Precipitation Days | 45.1 |
| Average Annual Precipitation | 19.4 |
| Average Annual Snowfall | 73.6 |
Average High
Days of Rain
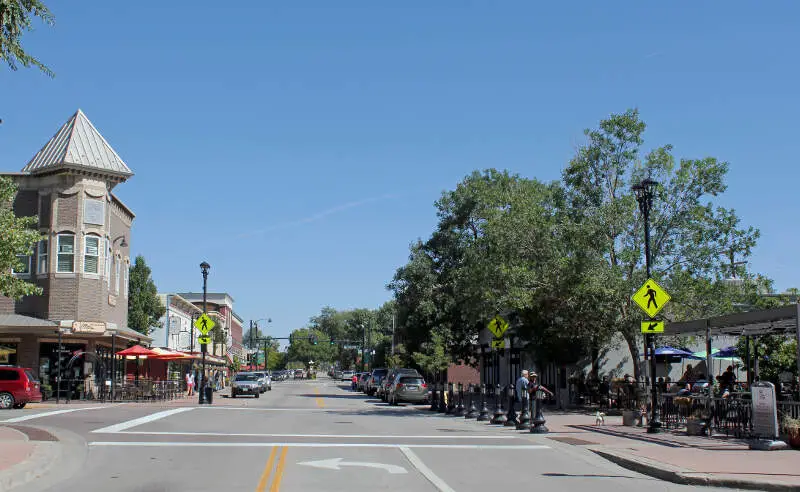
Parker, CO Photos
1 Reviews & Comments About Parker
/5

HomeSnacks User - None
I had to go to Parker to buy a peacock who was losing his mini-farm to development. Oh my G*d you do not want to live in Parker. Just the road rage and crowding alone flunks Parker.
Rankings for Parker in Colorado


Locations Around Parker
Map Of Parker, CO
Best Places Around Parker
Sheridan, CO
Population 6,031
Aurora, CO
Population 390,201
Dove Valley, CO
Population 5,313
Englewood, CO
Population 33,774
Denver, CO
Population 713,734
Lone Tree, CO
Population 14,136
Littleton, CO
Population 45,092
Castle Rock, CO
Population 76,614
Roxborough Park, CO
Population 9,365
The Pinery, CO
Population 11,740
Parker Demographics And Statistics
Population over time in Parker
The current population in Parker is 60,115. The population has increased 41.3% from 2010.
| Year | Population | % Change |
|---|---|---|
| 2023 | 60,115 | 2.4% |
| 2022 | 58,733 | 2.5% |
| 2021 | 57,311 | 3.3% |
| 2020 | 55,460 | 2.0% |
| 2019 | 54,352 | 3.4% |
| 2018 | 52,563 | 2.8% |
| 2017 | 51,125 | 5.5% |
| 2016 | 48,442 | 2.3% |
| 2015 | 47,342 | -0.4% |
| 2014 | 47,515 | 2.4% |
| 2013 | 46,390 | 2.6% |
| 2012 | 45,195 | 2.7% |
| 2011 | 44,026 | 3.5% |
| 2010 | 42,548 | - |
Race / Ethnicity in Parker
Parker is:
74.6% White with 44,816 White residents.
1.2% African American with 698 African American residents.
0.2% American Indian with 107 American Indian residents.
5.6% Asian with 3,394 Asian residents.
0.0% Hawaiian with 0 Hawaiian residents.
0.5% Other with 310 Other residents.
4.7% Two Or More with 2,838 Two Or More residents.
13.2% Hispanic with 7,952 Hispanic residents.
| Race | Parker | CO | USA |
|---|---|---|---|
| White | 74.6% | 65.7% | 58.2% |
| African American | 1.2% | 3.8% | 12.0% |
| American Indian | 0.2% | 0.4% | 0.5% |
| Asian | 5.6% | 3.2% | 5.7% |
| Hawaiian | 0.0% | 0.1% | 0.2% |
| Other | 0.5% | 0.4% | 0.5% |
| Two Or More | 4.7% | 4.2% | 3.9% |
| Hispanic | 13.2% | 22.2% | 19.0% |
Gender in Parker
Parker is 50.2% female with 30,173 female residents.
Parker is 49.8% male with 29,941 male residents.
| Gender | Parker | CO | USA |
|---|---|---|---|
| Female | 50.2% | 49.4% | 50.5% |
| Male | 49.8% | 50.6% | 49.5% |
Highest level of educational attainment in Parker for adults over 25
2.0% of adults in Parker completed < 9th grade.
1.0% of adults in Parker completed 9-12th grade.
15.0% of adults in Parker completed high school / ged.
20.0% of adults in Parker completed some college.
8.0% of adults in Parker completed associate's degree.
35.0% of adults in Parker completed bachelor's degree.
16.0% of adults in Parker completed master's degree.
2.0% of adults in Parker completed professional degree.
1.0% of adults in Parker completed doctorate degree.
| Education | Parker | CO | USA |
|---|---|---|---|
| < 9th Grade | 2.0% | 2.0% | 5.0% |
| 9-12th Grade | 1.0% | 4.0% | 6.0% |
| High School / GED | 15.0% | 20.0% | 26.0% |
| Some College | 20.0% | 20.0% | 19.0% |
| Associate's Degree | 8.0% | 8.0% | 9.0% |
| Bachelor's Degree | 35.0% | 28.0% | 21.0% |
| Master's Degree | 16.0% | 13.0% | 10.0% |
| Professional Degree | 2.0% | 3.0% | 2.0% |
| Doctorate Degree | 1.0% | 2.0% | 2.0% |
Household Income For Parker, Colorado
1.9% of households in Parker earn Less than $10,000.
0.9% of households in Parker earn $10,000 to $14,999.
2.4% of households in Parker earn $15,000 to $24,999.
2.3% of households in Parker earn $25,000 to $34,999.
5.0% of households in Parker earn $35,000 to $49,999.
11.2% of households in Parker earn $50,000 to $74,999.
12.0% of households in Parker earn $75,000 to $99,999.
23.0% of households in Parker earn $100,000 to $149,999.
18.2% of households in Parker earn $150,000 to $199,999.
23.2% of households in Parker earn $200,000 or more.
| Income | Parker | CO | USA |
|---|---|---|---|
| Less than $10,000 | 1.9% | 3.9% | 4.9% |
| $10,000 to $14,999 | 0.9% | 2.6% | 3.6% |
| $15,000 to $24,999 | 2.4% | 5.0% | 6.6% |
| $25,000 to $34,999 | 2.3% | 5.3% | 6.8% |
| $35,000 to $49,999 | 5.0% | 8.9% | 10.4% |
| $50,000 to $74,999 | 11.2% | 15.0% | 15.7% |
| $75,000 to $99,999 | 12.0% | 13.0% | 12.7% |
| $100,000 to $149,999 | 23.0% | 19.3% | 17.4% |
| $150,000 to $199,999 | 18.2% | 11.3% | 9.3% |
| $200,000 or more | 23.2% | 15.8% | 12.6% |


