Bostonvs.San Francisco Which City Is Right for You in 2026?
A head-to-head guide to cost of living, jobs, transportation, weather, crime, and quality of life — so you can decide where to live, work, or visit.
Updated 2026-05-26 · By HomeSnacks Editorial
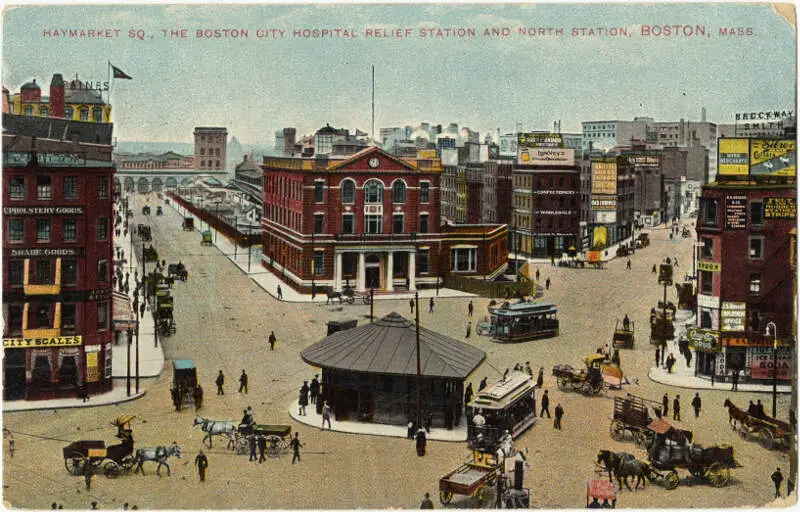
Boston
Boston vs. San Francisco at a glance
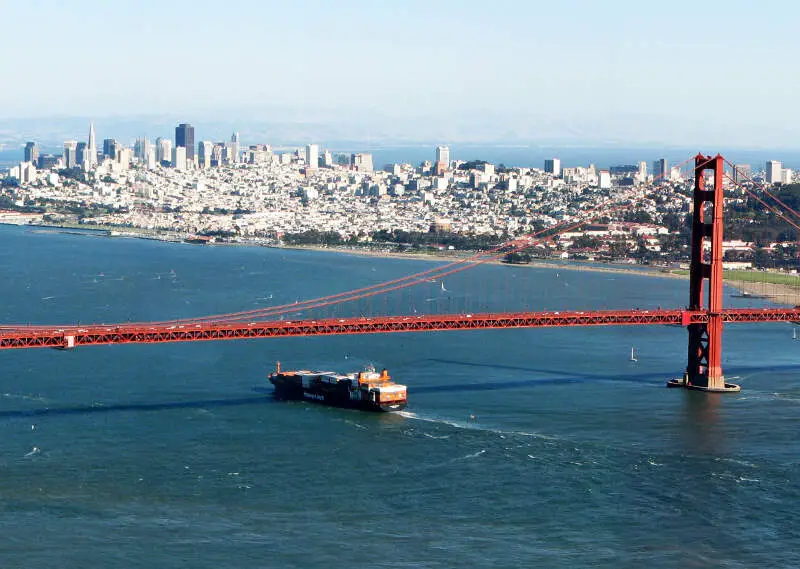
Boston, MA and San Francisco, CA sit at very different points on the U.S. map — and the numbers reflect it. Boston is the capital and most populous city of the U.S. state of Massachusetts. It serves as a cultural and financial center of New England, a region of the Northeastern United States. San Francisco, officially the City and County of San Francisco, is the fourth-most populous city in California and the 17th-most populous in the United States, with a population of 826,079 in 2025. Among U.S.
On cost of living, Boston is the cheaper city: its overall index sits at 171 versus 247 in San Francisco (100 = national average). Median home values run $798,216 in Boston and $1,356,661 in San Francisco, with median rents at $2,147 and $2,476 respectively. That puts the home-value-to-income ratio at 8.2x in Boston versus 9.6x in San Francisco.
Safety is where the comparison sharpens. Boston reports 2,650 total crimes per 100,000 residents annually versus 4,526 in San Francisco. Boston is the more racially diverse of the two on a Herfindahl index basis — Boston skews 44% White while San Francisco skews 37% White. On HomeSnacks' overall SnackAbility score, San Francisco edges ahead at 8.5/10 versus 8/10 for Boston.
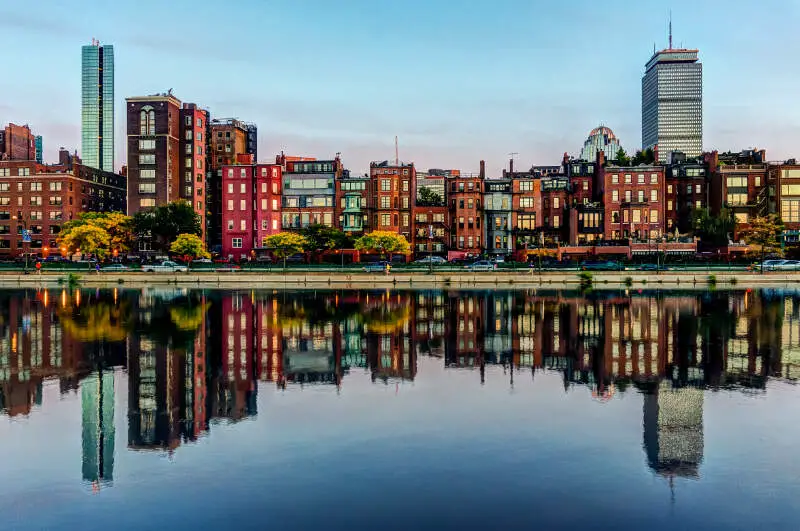
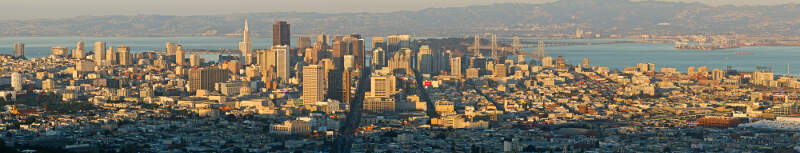
Boston vs. San Francisco in photos
A side-by-side look at each city.


Cost of living
Boston is the cheaper city overall — 31% higher in San Francisco than its rival. Index baseline: 100 = national average.
| Living expense | Boston | San Francisco | US average |
|---|---|---|---|
| Overall | 171 | 247 | 100 |
| Services | 109 | 122 | 100 |
| Groceries | 122 | 125 | 100 |
| Health | 276 | 518 | 100 |
| Housing | 120 | 132 | 100 |
| Transportation | 127 | 128 | 100 |
| Utilities | 132 | 139 | 100 |
Lower index = cheaper. 100 = U.S. national average. Bar inside each cell scales relative to the highest value in the table.
Sources: HomeSnacks Cost of Living indices, normalized so 100 = U.S. national average. Drill in: Boston cost of living, San Francisco cost of living, or the cheapest cities in America.
Housing breakdown
Home prices are higher in Boston. Compare absolute price and price-to-income — a $500k home in a $100k-income city is very different from one in a $50k-income city.
| Metric | Boston | San Francisco | United States |
|---|---|---|---|
| Median Home Value | $798,216 | $1,356,661 | $332,700 |
| Median Rent | $2,147 | $2,476 | $1,413 |
| Median Income | $97,344 | $140,970 | $80,734 |
| Home Value To Income | 8.2x | 9.6x | 4.1x |
| Rent To Monthly Income | 0.26x | 0.21x | 0.21x |
Source: U.S. Census Bureau ACS 2020-2024. See also states with the highest rent in America.
Crime
Boston is the safer city — total crime rate of 2,650 per 100k people vs 4,526 for San Francisco. US average: 2,119.
| Crime (per 100k) | Boston | San Francisco | US average |
|---|---|---|---|
| Total crime | 2,650 | 4,526 | 2,119 |
| Murder | 4 | 4 | 5 |
| Robbery | 126 | 267 | 61 |
| Aggravated Assault | 472 | 290 | 256 |
| Violent Crime | 628 | 596 | 359 |
| Burglary | 178 | 637 | 229 |
| Larceny | 1,687 | 2,619 | 1,272 |
| Car Theft | 157 | 673 | 259 |
| Property Crime | 2,022 | 3,929 | 1,760 |
Lower = safer. Bar inside each cell scales relative to the highest crime rate in the table.
Source: FBI Uniform Crime Reporting (2024). All rates are per 100,000 people. City pages: Boston crime, San Francisco crime. See also: safest cities in America.
Diversity
Boston is more racially diverse — lower HHI (closer to 0) means a more even mix across groups.
| Group | Boston | San Francisco | United States |
|---|---|---|---|
| White | 44.1% | 36.8% | 57.4% |
| African American | 19.3% | 4.7% | 11.9% |
| American Indian | 0.1% | 0.2% | 0.5% |
| Asian | 10.3% | 34.9% | 5.9% |
| Hawaiian | 0.0% | 0.3% | 0.2% |
| Other | 1.0% | 0.8% | 0.6% |
| Two Or More | 5.9% | 6.1% | 4.3% |
| Hispanic | 19.3% | 16.2% | 19.3% |
Source: U.S. Census ACS 2020-2024. Lower HHI = more even racial mix. See also: most diverse cities in America.
SnackAbility — overall quality of life
San Francisco scores higher overall — 8.5/10 vs 8/10. SnackAbility is our 1–10 quality-of-life score; the median U.S. city scores a 7.
SnackAbility is a HomeSnacks proprietary 1–10 score blending jobs, housing, education, commute, amenities, affordability, crime, and diversity. Median U.S. city ≈ 7. Data: Census, BLS, FBI. See also: best places to live in America.
Getting around: Boston vs. San Francisco
How each city handles commuting, transit, walkability, and car culture — the day-to-day reality that shapes where you'd actually want to live.
Boston's MBTA (locals call it the T) gives you real car-free options. The Red Line connects Cambridge and Kendall Square to downtown; the Green Line threads through Back Bay and Fenway. The commuter rail reaches suburbs as far as Providence.
Walkability is genuinely high in neighborhoods like Beacon Hill and the South End. A growing network of protected bike lanes makes cycling viable nine months of the year, if you can handle the cold.
San Francisco's BART links you to Oakland, Berkeley, and the airport, while Muni buses and light rail cover the city itself. The cable cars are charming but slow. Most residents rely on BART or Muni for actual commuting.
Driving in SF is often worse than Boston: hills, scarce parking, and bridge tolls add up fast. If you're commuting down the Peninsula to a tech campus, expect a long ride on Caltrain or a packed shuttle bus.
Jobs and careers in Boston vs. San Francisco
The local job market, dominant industries, and which city to choose based on your career.
Boston punches above its population in high-skill industries. Kendall Square is one of the densest biotech and life-sciences clusters in the world, with Moderna, Biogen, and dozens of startups within a few blocks. The Longwood Medical Area adds hospitals and research institutions.
Finance, law, and higher education fill out the picture, with Harvard, MIT, BU, and Northeastern all in or near the city. Median household income sits at $97,344, and a cost-of-living index of 171 means your dollar goes meaningfully further than in SF.
San Francisco has the higher median household income ($140,970), driven largely by the tech sector in SoMa, Mission Bay, and the broader Bay Area corridor to Silicon Valley. A cost-of-living index of 247 erodes a lot of that advantage: median rent hits $2,476 versus Boston's $2,147.
If your career is in software engineering or venture-backed startups, SF's network effects are hard to beat. For biotech, clinical research, or academia, Boston is a genuine rival.
Weather and climate
What to expect day-to-day — sun, fog, heat, rain, and the seasonal extremes that shape the lifestyle.
Boston has four honest seasons, and that cuts both ways. Winters are real: expect nor'easters, stretches of below-freezing temperatures from December through February, and occasional blizzards that shut down the city. Summers are warm and humid, with July highs regularly in the upper 80s.
Spring and fall are genuinely beautiful, especially when the foliage peaks across the Public Garden and along the Charles River in October.
San Francisco's climate is famously mild but often misunderstood. Summers are cool and foggy. Karl the Fog rolls in off the Pacific most July mornings, and you'll want a jacket even in August.
Winters are wet rather than cold, rarely dropping below the mid-40s. If you hate snow and don't mind gray skies and 58-degree summers, SF wins on comfort. If you want actual summer warmth, you'll be driving to the East Bay or heading inland.
Boston gives you more seasonal variety; SF gives you fewer weather emergencies.
Culture, nightlife, and entertainment
Food, music, neighborhoods, and the city vibe that gives each place its personality.
Boston's cultural identity runs deep and sometimes stubborn. The Museum of Fine Arts and the Isabella Stewart Gardner Museum anchor a serious art scene. Symphony Hall is one of the best acoustic venues in the country.
Neighborhood character is strong. The North End remains a genuine Italian-American enclave, Southie holds its Irish-American identity, and the college population keeps bars, music venues, and late-night food busy year-round. Sports loyalty here borders on religion: Fenway Park, TD Garden, and decades of championship teams have shaped the city's personality for good.
San Francisco's cultural range is broader and more experimental. The Mission District's murals and taquerias, the Castro's history as a center of LGBTQ+ culture, and Hayes Valley's independent boutiques and wine bars give the city a neighborhood-by-neighborhood diversity that Boston is still building.
Live music is woven into daily life. The Fillmore and the Independent host acts that Boston venues often miss. The restaurant scene skews more globally adventurous, and the city's counterculture history still shapes its creative energy in ways you'll notice within the first week.
Outdoor activities and day trips
Parks, beaches, hikes, and the weekend escapes that define life outside the city limits.
Boston's outdoor life centers on Frederick Law Olmsted's Emerald Necklace, a chain of parks stretching from the Back Bay Fens to Franklin Park. The Charles River Esplanade is a top-tier running and cycling corridor, and Boston Harbor Islands offer kayaking and ferry day trips you'd never expect from a northeastern city.
When you want to leave town, Cape Cod is two hours south and the White Mountains of New Hampshire are two hours north, making weekend escapes genuinely easy.
San Francisco's outdoor proximity is almost unfair. Golden Gate Park rivals any urban green space in the country, and the Marin Headlands sit just across the bridge. You can be hiking above the Pacific in under an hour from downtown.
Point Reyes National Seashore, Muir Woods, and Mount Tamalpais are all reachable on a Saturday morning. For bigger adventures, Lake Tahoe is about three and a half hours away. If year-round outdoor access without winter gear is a priority, San Francisco's geography is hard to argue with.
Bottom line: which city is right for you?
Based on the head-to-head data above, here's the short version — pick the city that lines up with what you actually care about.
Choose Boston if you prioritize…
- a lower cost of living (cheaper groceries, services, and day-to-day expenses).
- lower crime — a safer place to live, work, and raise a family.
- more affordable housing relative to San Francisco.
- a more racially diverse community (lower HHI on Census data).
Choose San Francisco if you prioritize…
- a higher overall SnackAbility quality-of-life score.
Methodology: winners are picked from public data — U.S. Census Bureau ACS (income, home value, rent, race/HHI), FBI Uniform Crime Reporting (crime rates per 100k), and HomeSnacks' proprietary SnackAbility quality-of-life score, which blends Bureau of Labor Statistics data with the above.
More about Massachusetts & California

Best Places To Live In Massachusetts
Photo: Public domain
Cheapest Places To Live In Massachusetts
Photo: Public domain
Most Dangerous Cities In Massachusetts
Photo: Public domain
Best Places To Raise A Family In Massachusetts
Photo: Public domain
Best Places To Retire In Massachusetts
Photo: Public domain
Richest Cities In Massachusetts
Photo: Public domain
Safest Places In Massachusetts
Photo: Public domain
Worst Places To Live In Massachusetts
Photo: Public domain