Newarkvs.Jersey City Which City Is Right for You in 2026?
A head-to-head guide to cost of living, jobs, transportation, weather, crime, and quality of life — so you can decide where to live, work, or visit.
Updated 2026-05-26 · By HomeSnacks Editorial
Newark vs. Jersey City at a glance
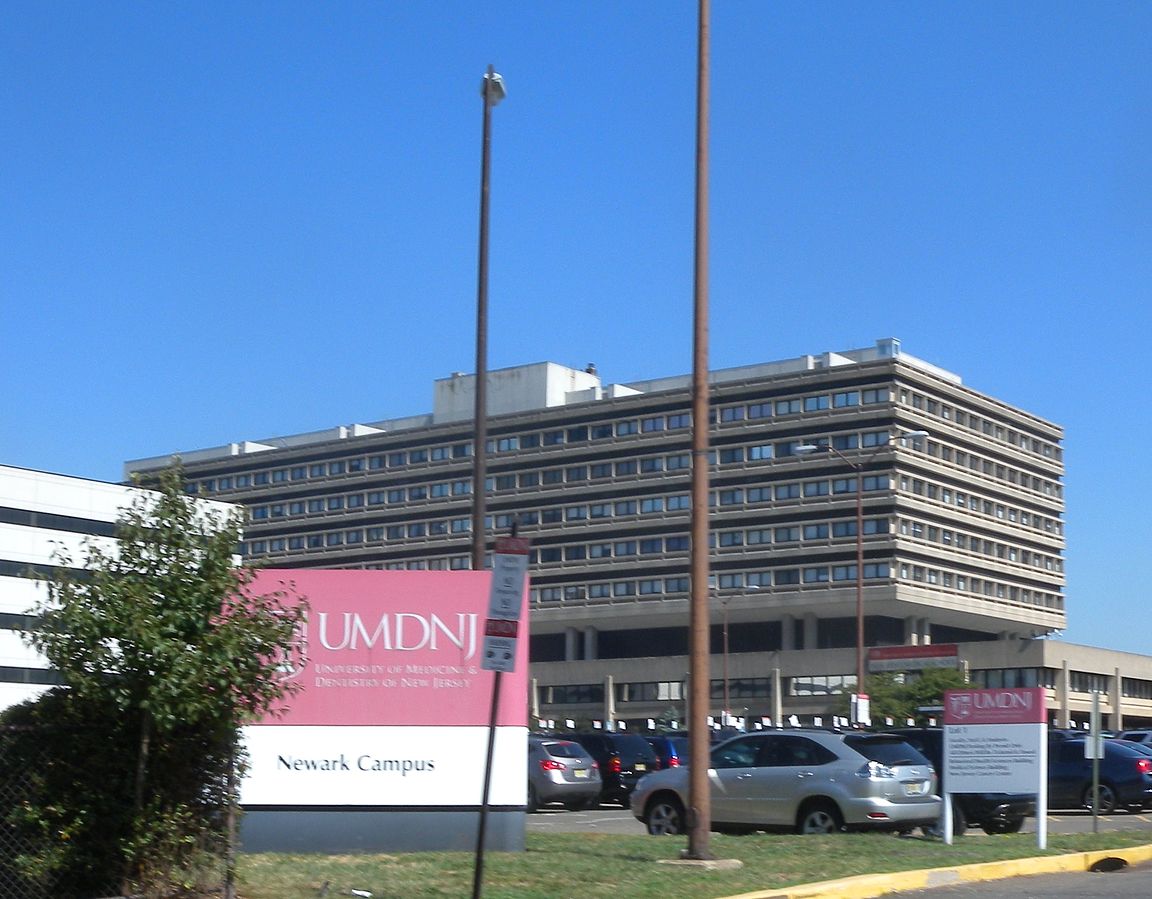
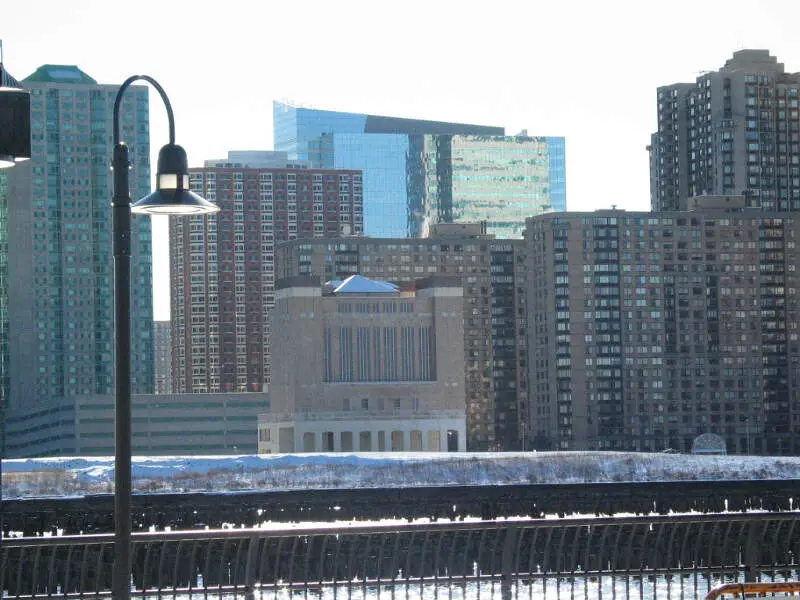
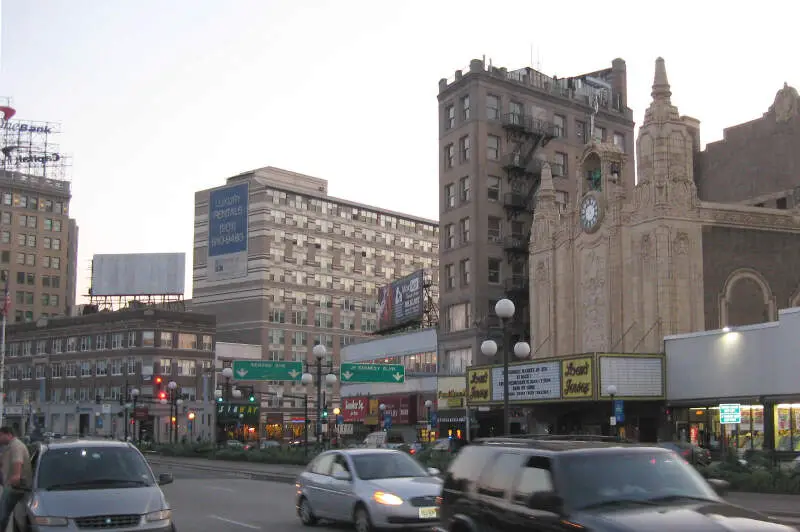
Newark, NJ and Jersey City, NJ are frequently compared, and for good reason — they offer very different lifestyles at very different price points. Newark is the most populous city in the U.S. state of New Jersey, the county seat of Essex County, and a principal city of the New York metropolitan area. As of the 2020 census, the city's population was 311,549. Jersey City is the second-most populous city in the U.S. state of New Jersey, after Newark. It is the county seat of Hudson County, the county's most populous city and its largest by area.
On cost of living, Newark is the cheaper city: its overall index sits at 121 versus 146 in Jersey City (100 = national average). Median home values run $478,454 in Newark and $658,269 in Jersey City, with median rents at $1,392 and $2,007 respectively. That puts the home-value-to-income ratio at 9.2x in Newark versus 6.7x in Jersey City.
Safety is where the comparison sharpens. Newark reports 2,539 total crimes per 100,000 residents annually versus 2,591 in Jersey City. Jersey City is the more racially diverse of the two on a Herfindahl index basis — Newark skews 45% Black while Jersey City skews 26% Asian. On HomeSnacks' overall SnackAbility score, Jersey City edges ahead at 8/10 versus 4/10 for Newark.
Newark vs. Jersey City in photos
A side-by-side look at each city.


Cost of living
Newark is the cheaper city overall — 17% higher in Jersey City than its rival. Index baseline: 100 = national average.
| Living expense | Newark | Jersey City | US average |
|---|---|---|---|
| Overall | 121 | 146 | 100 |
| Services | 106 | 113 | 100 |
| Groceries | 110 | 116 | 100 |
| Health | 135 | 202 | 100 |
| Housing | 119 | 125 | 100 |
| Transportation | 110 | 115 | 100 |
| Utilities | 117 | 125 | 100 |
Lower index = cheaper. 100 = U.S. national average. Bar inside each cell scales relative to the highest value in the table.
Sources: HomeSnacks Cost of Living indices, normalized so 100 = U.S. national average. Drill in: Newark cost of living, Jersey City cost of living, or the cheapest cities in America.
Housing breakdown
Home prices are higher in Jersey City. Compare absolute price and price-to-income — a $500k home in a $100k-income city is very different from one in a $50k-income city.
| Metric | Newark | Jersey City | United States |
|---|---|---|---|
| Median Home Value | $478,454 | $658,269 | $332,700 |
| Median Rent | $1,392 | $2,007 | $1,413 |
| Median Income | $52,060 | $97,710 | $80,734 |
| Home Value To Income | 9.2x | 6.7x | 4.1x |
| Rent To Monthly Income | 0.32x | 0.25x | 0.21x |
Source: U.S. Census Bureau ACS 2020-2024. See also states with the highest rent in America.
Crime
Newark is the safer city — total crime rate of 2,539 per 100k people vs 2,591 for Jersey City. US average: 2,119.
| Crime (per 100k) | Newark | Jersey City | US average |
|---|---|---|---|
| Total crime | 2,539 | 2,591 | 2,119 |
| Murder | 13 | 2 | 5 |
| Robbery | 143 | 173 | 61 |
| Aggravated Assault | 385 | 357 | 256 |
| Violent Crime | 581 | 562 | 359 |
| Burglary | 152 | 206 | 229 |
| Larceny | 931 | 1,526 | 1,272 |
| Car Theft | 874 | 297 | 259 |
| Property Crime | 1,957 | 2,029 | 1,760 |
Lower = safer. Bar inside each cell scales relative to the highest crime rate in the table.
Source: FBI Uniform Crime Reporting (2024). All rates are per 100,000 people. City pages: Newark crime, Jersey City crime. See also: safest cities in America.
Diversity
Jersey City is more racially diverse — lower HHI (closer to 0) means a more even mix across groups.
| Group | Newark | Jersey City | United States |
|---|---|---|---|
| White | 8.9% | 23.5% | 57.4% |
| African American | 44.8% | 19.2% | 11.9% |
| American Indian | 0.1% | 0.2% | 0.5% |
| Asian | 2.0% | 26.5% | 5.9% |
| Hawaiian | 0.0% | 0.0% | 0.2% |
| Other | 2.5% | 1.2% | 0.6% |
| Two Or More | 4.1% | 3.7% | 4.3% |
| Hispanic | 37.6% | 25.7% | 19.3% |
Source: U.S. Census ACS 2020-2024. Lower HHI = more even racial mix. See also: most diverse cities in America.
SnackAbility — overall quality of life
Jersey City scores higher overall — 8/10 vs 4/10. SnackAbility is our 1–10 quality-of-life score; the median U.S. city scores a 7.
SnackAbility is a HomeSnacks proprietary 1–10 score blending jobs, housing, education, commute, amenities, affordability, crime, and diversity. Median U.S. city ≈ 7. Data: Census, BLS, FBI. See also: best places to live in America.
Getting around: Newark vs. Jersey City
How each city handles commuting, transit, walkability, and car culture — the day-to-day reality that shapes where you'd actually want to live.
If getting into Manhattan without a car is your priority, both cities deliver, but through slightly different networks. Newark Penn Station connects you to New York Penn via the Northeast Corridor in under 20 minutes on NJ Transit, and the PATH train runs around the clock from downtown Newark into lower and midtown Manhattan. Newark Liberty International Airport is a real advantage if you fly frequently, with far less congestion than JFK or LaGuardia.
Jersey City leans even harder on the PATH, with four stops (Journal Square, Grove Street, Exchange Place, and Newport) feeding directly into the World Trade Center and 33rd Street. The Hudson-Bergen Light Rail connects the waterfront to inland neighborhoods, and a NY Waterway ferry from the Paulus Hook terminal is a crowd-free alternative on nice mornings. If you commute by car, expect the same cross-Hudson gridlock from either city; the tunnels and bridges play no favorites.
Jobs and careers in Newark vs. Jersey City
The local job market, dominant industries, and which city to choose based on your career.
Newark's economy runs on institutions rather than finance. Prudential Financial's global headquarters is downtown, the Port Newark-Elizabeth Marine Terminal drives logistics and trade employment, and Rutgers University-Newark along with RWJBarnabas Health keep healthcare and education payrolls steady. The median household income of $52,060 reflects a job market weighted toward public-sector, service, and blue-collar work, and a cost of living index of 121 means your dollar goes further here than in Jersey City.
Jersey City has a different profile. Exchange Place has become a real financial district, with back-office and trading operations for Goldman Sachs, JPMorgan Chase, and Verisk Analytics, and the tech sector has grown steadily around Newport. The median household income of $97,710 (nearly double Newark's) reflects that concentration of professional roles, though a cost of living index of 146 and median rent of $2,007 versus Newark's $1,392 narrow the difference considerably.
Weather and climate
What to expect day-to-day — sun, fog, heat, rain, and the seasonal extremes that shape the lifestyle.
Neither city will surprise you with exotic weather. You're in the same humid subtropical pocket of the mid-Atlantic, and their climates are functionally identical. Summers run hot and muggy, with July averages in the upper 80s and heat indexes that push past 90 on bad days.
Snowfall is real but rarely paralyzing; expect a handful of meaningful storms between December and March, with winters averaging in the low 30s at night. Spring is genuinely pleasant in both places: mild temperatures, lower humidity, and enough sunshine to make the region feel livable again after February. Fall is arguably the best season, with crisp air and comfortable highs through October.
Neither city has a weather edge. The biggest climate factor in your daily life will be whether your commute puts you in an exposed PATH station or a wind-whipped ferry terminal, not which side of the Hudson you live on.
Culture, nightlife, and entertainment
Food, music, neighborhoods, and the city vibe that gives each place its personality.
Newark's cultural footprint is larger than its reputation suggests. The New Jersey Performing Arts Center draws orchestral and Broadway touring productions, the Prudential Center hosts the Devils along with major concerts, and the Newark Museum of Art has a strong African American art collection. The Ironbound district (centered on Ferry Street) is one of the best Portuguese and Brazilian dining corridors on the East Coast, and the neighborhood's energy on a weekend night rivals anything in Hudson County.
Jersey City's nightlife has grown fast alongside its population. The Grove Street and Van Vorst Park neighborhoods are packed with cocktail bars, independent restaurants, and coffee shops drawing a younger professional crowd priced out of Manhattan. The Powerhouse Arts District adds gallery openings and creative events; with a median income of $97,710 driving the market, prices run closer to Brooklyn than to Newark, but the variety is real if your budget aligns.
Outdoor activities and day trips
Parks, beaches, hikes, and the weekend escapes that define life outside the city limits.
Newark's standout green space is Branch Brook Park, designed by the Olmsted Brothers and home to the largest cherry blossom collection in the United States, with more trees than Washington D.C.'s Tidal Basin. The park's 4-mile stretch through the North Ward works well for joggers and cyclists, and Weequahic Park in the South Ward adds a lake and golf course. The Essex County trail network extends into the Watchung Reservation for anyone willing to drive 30 minutes west.
Jersey City's biggest outdoor draw is Liberty State Park: 1,200 acres of waterfront with unobstructed views of the Statue of Liberty and Ellis Island, kayak launches, a restored historic rail terminal, and ferry access to both landmarks. The Hudson River Waterfront Walkway runs along the eastern edge of the city, and Caven Point offers a quiet natural area near the park's southern end. For everyday outdoor access, Jersey City's waterfront has few rivals in the region.
Bottom line: which city is right for you?
Based on the head-to-head data above, here's the short version — pick the city that lines up with what you actually care about.
Choose Newark if you prioritize…
- a lower cost of living (cheaper groceries, services, and day-to-day expenses).
- lower crime — a safer place to live, work, and raise a family.
Choose Jersey City if you prioritize…
- more affordable housing relative to Newark.
- a more racially diverse community (lower HHI on Census data).
- a higher overall SnackAbility quality-of-life score.
Methodology: winners are picked from public data — U.S. Census Bureau ACS (income, home value, rent, race/HHI), FBI Uniform Crime Reporting (crime rates per 100k), and HomeSnacks' proprietary SnackAbility quality-of-life score, which blends Bureau of Labor Statistics data with the above.
More about New Jersey

Best Places To Live In New Jersey
Photo: Public domain
Cheapest Places To Live In New Jersey
Photo: Public domain
Most Dangerous Cities In New Jersey
Photo: Public domain
Best Places To Raise A Family In New Jersey
Photo: Public domain
Best Places To Retire In New Jersey
Photo: Public domain
Richest Cities In New Jersey
Photo: Public domain
Safest Places In New Jersey
Photo: Public domain
Worst Places To Live In New Jersey
Photo: Public domain