
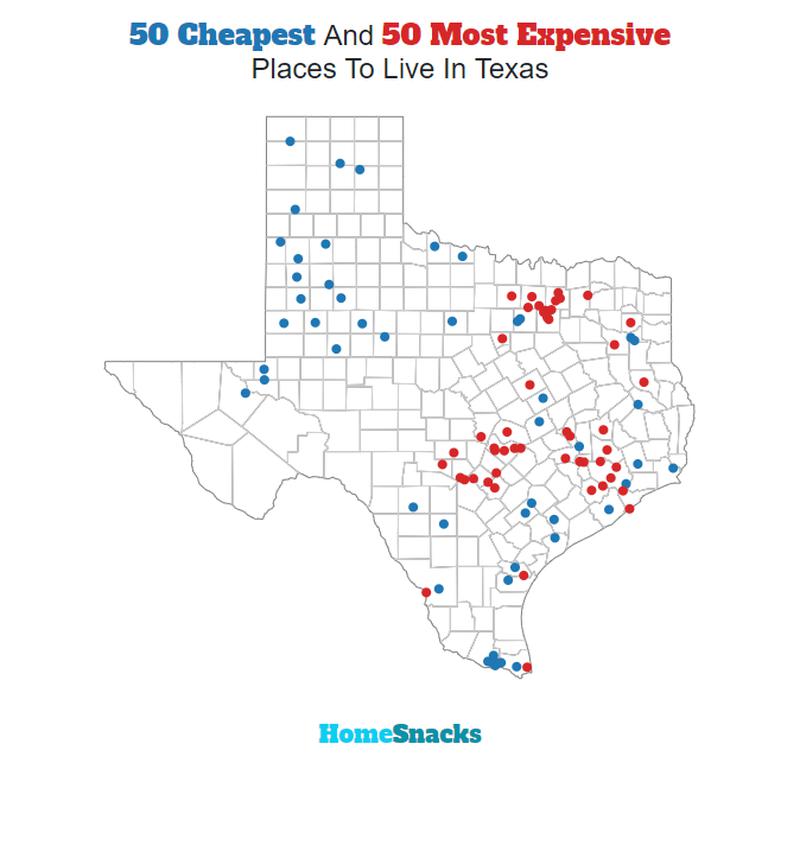
The Lone Star State is a massive place that can accommodate all walks of life. But we’ve done the research to discover which cities are the most expensive to live in Texas for 2026.
Just where are these deep pockets of extreme wealth in Texas? By and large, the places you’ll see on this list are in the southern region of the state, with many cities no farther than an hour outside of Houston or San Antonio.
If you put a premium on live music, then you won’t mind paying extra to live in Austin, the city with the most live music venues per capita in the country. If you’re looking for the priciest suburb of Dallas, Addison is the spot for you.
How did we come up with this list of pricey places? We looked at the cost of living from the Census to compare home prices and rents across Texas. We found that you need to earn at least $181,352/year to live in the upper echelon of Texan society.
Table Of Contents: Top Ten | Methodology | Summary | Table
The 10 Most Expensive Places To Live In Texas For 2026
What’s the most expensive place to live in Texas? Well, HomeSnacks crunched the numbers and discovered that Highland Park is the most expensive place to live in Texas.
Donna (the cheapest place to live in Texas) can show these guys how to live on a budget in the coming years. Read on for how these places had costs rise faster than inflation.
And if you already knew these places were expensive, check out some more reading about Texas and the most expensive cities in the country:
The 10 Most Expensive Places To Live In Texas For 2026

/10
Population: 8,773
Cost Of Living Index: 256
Median Income: $250,001
Average Home Price: $2,891,618
Home Price To Income Ratio: 11.6x
More on Highland Park: Data | Crime | Cost Of Living | Movers
The overall cost of living in Highland Park is 256. The median income in Highland Park comes in at $250,001 and the average home value is $2,891,618 for 2026.

/10
Population: 25,155
Cost Of Living Index: 245
Median Income: $250,001
Average Home Price: $2,420,170
Home Price To Income Ratio: 9.7x
More on University Park: Data | Crime | Cost Of Living | Movers
The overall cost of living in University Park is 245. The median income in University Park comes in at $250,001 and the average home value is $2,420,170 for 2026.

/10
Population: 14,982
Cost Of Living Index: 236
Median Income: $250,001
Average Home Price: $1,560,991
Home Price To Income Ratio: 6.2x
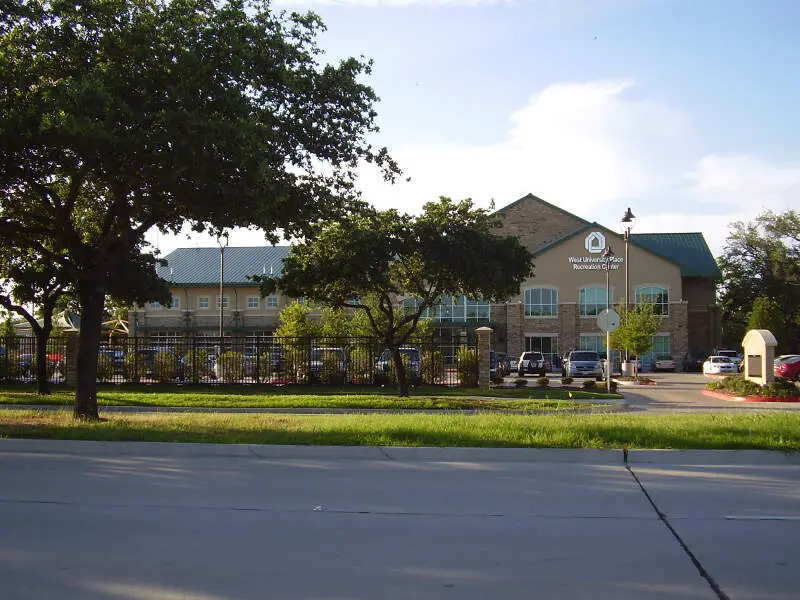
More on West University Place: Data | Crime | Cost Of Living | Movers
The overall cost of living in West University Place is 236. The median income in West University Place comes in at $250,001 and the average home value is $1,560,991 for 2026.

/10
Population: 17,206
Cost Of Living Index: 185
Median Income: $244,015
Average Home Price: $1,164,142
Home Price To Income Ratio: 4.8x
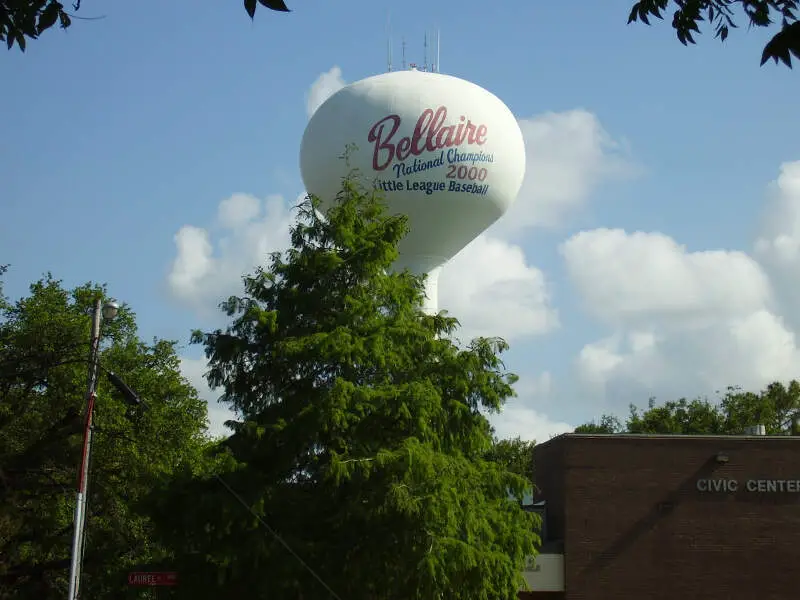
More on Bellaire: Data | Crime | Cost Of Living | Movers
The overall cost of living in Bellaire is 185. The median income in Bellaire comes in at $244,015 and the average home value is $1,164,142 for 2026.
/10
The overall cost of living in Parker is 180. The median income in Parker comes in at $229,080 and the average home value is $1,088,169 for 2026.
/10
Population: 5,070
Cost Of Living Index: 179
Median Income: $186,400
Average Home Price: $883,660
Home Price To Income Ratio: 4.7x
More on Terrell Hills: Data | Crime | Cost Of Living | Movers
The overall cost of living in Terrell Hills is 179. The median income in Terrell Hills comes in at $186,400 and the average home value is $883,660 for 2026.

/10
Population: 31,137
Cost Of Living Index: 165
Median Income: $250,001
Average Home Price: $1,301,364
Home Price To Income Ratio: 5.2x
More on Southlake: Data | Crime | Cost Of Living | Movers
The overall cost of living in Southlake is 165. The median income in Southlake comes in at $250,001 and the average home value is $1,301,364 for 2026.

/10
Population: 8,351
Cost Of Living Index: 159
Median Income: $221,364
Average Home Price: $1,074,130
Home Price To Income Ratio: 4.9x
More on Lucas: Data | Cost Of Living | Movers
The overall cost of living in Lucas is 159. The median income in Lucas comes in at $221,364 and the average home value is $1,074,130 for 2026.

/10
Population: 7,492
Cost Of Living Index: 159
Median Income: $183,088
Average Home Price: $731,191
Home Price To Income Ratio: 4.0x
More on Alamo Heights: Data | Crime | Cost Of Living | Movers
The overall cost of living in Alamo Heights is 159. The median income in Alamo Heights comes in at $183,088 and the average home value is $731,191 for 2026.
/10
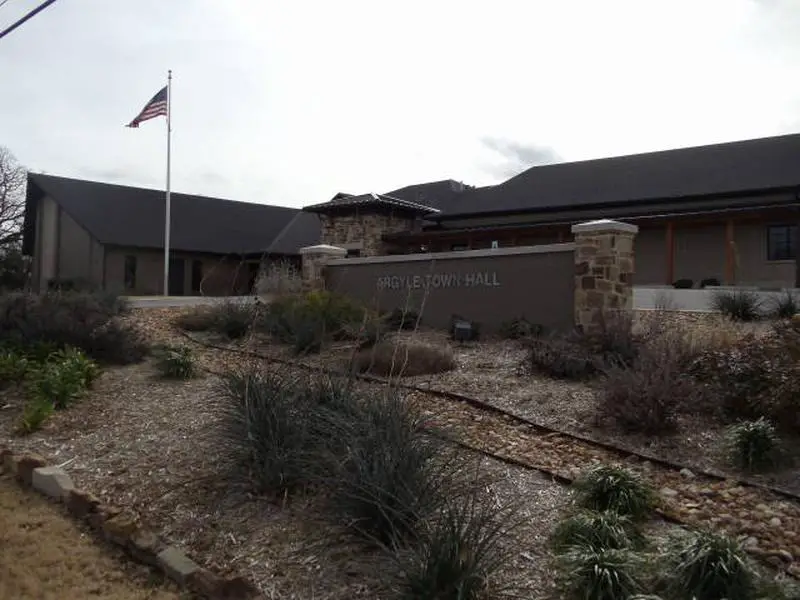
The overall cost of living in Argyle is 158. The median income in Argyle comes in at $181,352 and the average home value is $594,341 for 2026.
Methodology: How We Determined The Most Expensive Places To Live In The Lone Star State For 2026
The two most important things to think about when it comes to being able to afford a city in Texas are:
- How much money do I make?
- How much do I have to spend to live there?
You need to understand your costs in the context of how much money you make.
For example, if the median household earns $100,000 and spends $40,000 on housing, it’s actually cheaper to live there than a place with a median income of $50,000 and housing costs of $21,000. You might spend more on housing, but you have more money overall to play with.
With that example in mind, we derived several statistics from the latest Census American Community Survey 2020-2024 around incomes and costs. They are:
- Overall Cost Of Living Index
- Median Home Price / Median Income (lower is better)
- Median Income / Median Rent (Higher is better)
- Median Home Price
You can then compare these metrics in each of the places in Texas to figure out which is the most expensive.
You are left with a “Cost of Living Index” by taking the average rank of each of these metrics for each city.
So we used that cost of living index to rank all of the 372 places in Texas that have more than 5,000 people.
The place with the highest cost of living in Texas according to the data is Highland Park. We updated this article for 2026. This article is our eleventh time ranking the most expensive places to live in Texas.
Summary: Taking A Chunk Out Of Your Paycheck In Texas For 2026
Well, there you have it, the places in Texas that have the highest cost of living, with Highland Park ranking as the most expensive city in the Lone Star State.
The most expensive cities in Texas are Highland Park, University Park, West University Place, Bellaire, Parker, Terrell Hills, Southlake, Lucas, Alamo Heights, and Argyle.
Here’s a look at the most affordable cities in Texas according to the data:
- Donna
- Marlin
- Raymondville
For more Texas reading, check out:
- Best Places To Live In Texas
- Cheapest Places To Live In Texas
- Most Dangerous Places In Texas
- Best Places To Raise A Family In Texas
- Safest Places In Texas
- Worst Places To Live In Texas
Most Expensive Cities In Texas
| Rank | City | Cost Of Living | Population | Median Income | Average Home Price | Home/Income Ratio |
|---|---|---|---|---|---|---|
| 1 | Highland Park | 256 | 8,773 | $250,001 | $2,891,618 | 11.6x |
| 2 | University Park | 245 | 25,155 | $250,001 | $2,420,170 | 9.7x |
| 3 | West University Place | 236 | 14,982 | $250,001 | $1,560,991 | 6.2x |
| 4 | Bellaire | 185 | 17,206 | $244,015 | $1,164,142 | 4.8x |
| 5 | Parker | 180 | 5,999 | $229,080 | $1,088,169 | 4.8x |
| 6 | Terrell Hills | 179 | 5,070 | $186,400 | $883,660 | 4.7x |
| 7 | Southlake | 165 | 31,137 | $250,001 | $1,301,364 | 5.2x |
| 8 | Lucas | 159 | 8,351 | $221,364 | $1,074,130 | 4.9x |
| 9 | Alamo Heights | 159 | 7,492 | $183,088 | $731,191 | 4.0x |
| 10 | Argyle | 158 | 5,371 | $181,352 | $594,341 | 3.3x |
| 11 | Fair Oaks Ranch | 154 | 10,728 | $174,327 | $697,347 | 4.0x |
| 12 | Colleyville | 151 | 26,012 | $218,328 | $913,049 | 4.2x |
| 13 | Heath | 147 | 10,777 | $220,828 | $708,330 | 3.2x |
| 14 | Bee Cave | 146 | 8,862 | $111,172 | $823,338 | 7.4x |
| 15 | Lakeway | 145 | 19,307 | $190,060 | $741,100 | 3.9x |
| 16 | Fulshear | 143 | 34,868 | $187,035 | $505,480 | 2.7x |
| 17 | Prosper | 142 | 37,869 | $195,281 | $784,350 | 4.0x |
| 18 | Keller | 136 | 45,976 | $174,950 | $652,144 | 3.7x |
| 19 | Trophy Club | 136 | 13,733 | $201,054 | $701,040 | 3.5x |
| 20 | Fairview | 134 | 10,783 | $109,347 | $660,165 | 6.0x |
| 21 | Frisco | 133 | 219,304 | $150,212 | $656,757 | 4.4x |
| 22 | Coppell | 132 | 42,154 | $146,235 | $619,492 | 4.2x |
| 23 | Murphy | 131 | 21,188 | $175,699 | $571,960 | 3.3x |
| 24 | Northlake | 129 | 8,283 | $123,469 | $497,060 | 4.0x |
| 25 | Flower Mound | 128 | 78,389 | $161,235 | $609,719 | 3.8x |
| 26 | Highland Village | 128 | 16,101 | $159,828 | $587,436 | 3.7x |
| 27 | Helotes | 128 | 9,630 | $132,675 | $462,259 | 3.5x |
| 28 | Sugar Land | 126 | 110,016 | $136,217 | $447,176 | 3.3x |
| 29 | Grapevine | 125 | 51,139 | $111,376 | $552,148 | 5.0x |
| 30 | Melissa | 125 | 20,136 | $138,763 | $434,769 | 3.1x |
| 31 | Sunnyvale | 125 | 8,336 | $170,348 | $631,290 | 3.7x |
| 32 | Dripping Springs | 125 | 7,405 | $109,364 | $689,079 | 6.3x |
| 33 | Austin | 124 | 979,539 | $93,658 | $508,530 | 5.4x |
| 34 | Hickory Creek | 124 | 5,611 | $148,852 | $494,276 | 3.3x |
| 35 | Cedar Park | 123 | 78,301 | $129,545 | $471,698 | 3.6x |
| 36 | Addison | 123 | 17,290 | $73,854 | $490,587 | 6.6x |
| 37 | Oak Point | 123 | 5,887 | $126,290 | $419,834 | 3.3x |
| 38 | McKinney | 122 | 210,600 | $124,215 | $481,963 | 3.9x |
| 39 | Boerne | 122 | 20,518 | $84,541 | $554,313 | 6.6x |
| 40 | Plano | 120 | 290,594 | $112,253 | $498,989 | 4.4x |
| 41 | Allen | 120 | 110,265 | $130,901 | $493,531 | 3.8x |
| 42 | Celina | 120 | 34,268 | $170,894 | $546,742 | 3.2x |
| 43 | Roanoke | 120 | 10,286 | $97,295 | $428,020 | 4.4x |
| 44 | Fate | 119 | 22,884 | $132,752 | $361,761 | 2.7x |
| 45 | Willow Park | 119 | 5,874 | $132,045 | $407,700 | 3.1x |
| 46 | Georgetown | 118 | 85,999 | $95,062 | $426,798 | 4.5x |
| 47 | Little Elm | 118 | 54,820 | $119,219 | $403,396 | 3.4x |
| 48 | Jersey Village | 118 | 7,817 | $79,750 | $385,931 | 4.8x |
| 49 | Friendswood | 117 | 41,030 | $126,508 | $457,134 | 3.6x |
| 50 | Aledo | 117 | 5,825 | $163,231 | $537,267 | 3.3x |
| 51 | Richardson | 116 | 118,731 | $98,111 | $440,400 | 4.5x |
| 52 | Leander | 116 | 74,067 | $139,048 | $425,972 | 3.1x |
| 53 | Buda | 116 | 15,859 | $123,766 | $354,684 | 2.9x |
| 54 | Mont Belvieu | 116 | 9,020 | $132,781 | $439,307 | 3.3x |
| 55 | League City | 115 | 116,215 | $121,099 | $372,300 | 3.1x |
| 56 | Wylie | 115 | 60,334 | $119,522 | $421,547 | 3.5x |
| 57 | Bulverde | 115 | 6,486 | $112,188 | $476,431 | 4.2x |
| 58 | Carrollton | 113 | 133,740 | $101,396 | $406,039 | 4.0x |
| 59 | Mansfield | 113 | 77,510 | $121,126 | $444,292 | 3.7x |
| 60 | Cibolo | 113 | 35,109 | $122,365 | $335,092 | 2.7x |
| 61 | Seabrook | 113 | 13,768 | $102,726 | $348,376 | 3.4x |
| 62 | Lago Vista | 113 | 9,650 | $113,457 | $402,383 | 3.5x |
| 63 | Providence Village | 113 | 8,721 | $110,430 | $372,220 | 3.4x |
| 64 | College Station | 112 | 124,570 | $50,900 | $349,040 | 6.9x |
| 65 | Sachse | 112 | 30,491 | $131,808 | $433,036 | 3.3x |
| 66 | Anna | 112 | 24,330 | $105,593 | $349,537 | 3.3x |
| 67 | Fredericksburg | 112 | 11,419 | $64,534 | $517,758 | 8.0x |
| 68 | Woodway | 112 | 9,570 | $115,108 | $368,722 | 3.2x |
| 69 | Lavon | 112 | 6,498 | $131,303 | $349,797 | 2.7x |
| 70 | Nassau Bay | 112 | 5,230 | $71,696 | $397,246 | 5.5x |
| 71 | Round Rock | 111 | 127,786 | $99,287 | $407,077 | 4.1x |
| 72 | Pearland | 111 | 127,514 | $118,842 | $382,156 | 3.2x |
| 73 | Missouri City | 111 | 76,558 | $94,390 | $336,288 | 3.6x |
| 74 | Rowlett | 111 | 65,463 | $112,081 | $371,473 | 3.3x |
| 75 | Rockwall | 111 | 51,168 | $115,580 | $480,553 | 4.2x |
| 76 | The Colony | 111 | 45,454 | $114,511 | $406,282 | 3.5x |
| 77 | Corinth | 111 | 23,385 | $120,580 | $410,565 | 3.4x |
| 78 | Hutto | 110 | 35,483 | $118,834 | $338,959 | 2.9x |
| 79 | North Richland Hills | 109 | 70,780 | $97,305 | $367,727 | 3.8x |
| 80 | Pflugerville | 109 | 65,971 | $117,799 | $377,292 | 3.2x |
| 81 | Midlothian | 109 | 39,356 | $126,641 | $450,601 | 3.6x |
| 82 | Manvel | 109 | 14,758 | $118,808 | $443,743 | 3.7x |
| 83 | Selma | 109 | 11,503 | $97,066 | $289,154 | 3.0x |
| 84 | Justin | 109 | 5,447 | $114,157 | $371,850 | 3.3x |
| 85 | Lewisville | 108 | 131,080 | $89,233 | $393,895 | 4.4x |
| 86 | New Braunfels | 108 | 104,643 | $86,021 | $350,104 | 4.1x |
| 87 | Kyle | 108 | 56,823 | $90,323 | $299,795 | 3.3x |
| 88 | Schertz | 108 | 44,050 | $99,948 | $314,685 | 3.1x |
| 89 | Princeton | 108 | 25,229 | $105,200 | $294,071 | 2.8x |
| 90 | Red Oak | 108 | 17,077 | $104,561 | $344,821 | 3.3x |
| 91 | Bastrop | 108 | 11,156 | $81,551 | $351,851 | 4.3x |
| 92 | Midland | 107 | 136,640 | $89,585 | $328,325 | 3.7x |
| 93 | Cedar Hill | 107 | 48,879 | $101,909 | $314,930 | 3.1x |
| 94 | Manor | 107 | 18,603 | $84,529 | $323,301 | 3.8x |
| 95 | Iowa Colony | 107 | 12,891 | $144,092 | $339,031 | 2.4x |
| 96 | Dallas | 106 | 1,307,930 | $70,518 | $309,420 | 4.4x |
| 97 | Euless | 106 | 60,421 | $82,167 | $357,017 | 4.3x |
| 98 | Burleson | 106 | 52,918 | $93,928 | $338,944 | 3.6x |
| 99 | Farmers Branch | 106 | 36,645 | $91,186 | $377,733 | 4.1x |
| 100 | Forney | 106 | 31,532 | $104,112 | $311,401 | 3.0x |