Urbandale, IA
Demographics And Statistics
Living In Urbandale, Iowa Summary
Life in Urbandale research summary. HomeSnacks has been using Saturday Night Science to research the quality of life in Urbandale over the past nine years using Census, FBI, Zillow, and other primary data sources. Based on the most recently available data, we found the following about life in Urbandale:
The population in Urbandale is 46,026.
The median home value in Urbandale is $352,571.
The median income in Urbandale is $113,086.
The cost of living in Urbandale is 103 which is 1.0x higher than the national average.
The median rent in Urbandale is $1,176.
The unemployment rate in Urbandale is 2.9%.
The poverty rate in Urbandale is 6.3%.
The average high in Urbandale is 59.7° and the average low is 39.3°.
Urbandale SnackAbility
Overall SnackAbility
Urbandale, IA Crime Report
Crime in Urbandale summary. We use data from the FBI to determine the crime rates in Urbandale. Key points include:
There were 341 total crimes in Urbandale in the last reporting year.
The overall crime rate per 100,000 people in Urbandale is 723.7 / 100k people.
The violent crime rate per 100,000 people in Urbandale is 89.1 / 100k people.
The property crime rate per 100,000 people in Urbandale is 634.6 / 100k people.
Overall, crime in Urbandale is -65.85% below the national average.
Total Crimes
Below National Average
Crime In Urbandale Comparison Table
| Statistic | Count Raw |
Urbandale / 100k People |
Iowa / 100k People |
National / 100k People |
|---|---|---|---|---|
| Total Crimes Per 100K | 341 | 723.7 | 1,540.0 | 2,119.2 |
| Violent Crime | 42 | 89.1 | 243.3 | 359.0 |
| Murder | 0 | 0.0 | 2.1 | 5.0 |
| Robbery | 1 | 2.1 | 18.7 | 61.0 |
| Aggravated Assault | 36 | 76.4 | 187.2 | 256.0 |
| Property Crime | 299 | 634.6 | 1,296.8 | 1,760.0 |
| Burglary | 39 | 82.8 | 199.1 | 229.0 |
| Larceny | 194 | 411.7 | 962.6 | 1,272.0 |
| Car Theft | 66 | 140.1 | 135.1 | 259.0 |
Urbandale, IA Cost Of Living
Cost of living in Urbandale summary. We use data on the cost of living to determine how expensive it is to live in Urbandale. Real estate prices drive most of the variance in cost of living around Iowa. Key points include:
The cost of living in Urbandale is 103 with 100 being average.
The cost of living in Urbandale is 1.0x higher than the national average.
The median home value in Urbandale is $352,571.
The median income in Urbandale is $113,086.
Urbandale's Overall Cost Of Living
Higher Than The National Average
Cost Of Living In Urbandale Comparison Table
| Living Expense | Urbandale | Iowa | National Average | |
|---|---|---|---|---|
| Overall | 103 | 90 | 100 | |
| Services | 94 | 96 | 100 | |
| Groceries | 100 | 97 | 100 | |
| Health | 93 | 99 | 100 | |
| Housing | 123 | 75 | 100 | |
| Transportation | 90 | 99 | 100 | |
| Utilities | 88 | 94 | 100 | |
Urbandale, IA Weather
The average high in Urbandale is 59.7° and the average low is 39.3°.
There are 63.4 days of precipitation each year.
Expect an average of 35.5 inches of precipitation each year with 35.1 inches of snow.
| Stat | Urbandale |
|---|---|
| Average Annual High | 59.7 |
| Average Annual Low | 39.3 |
| Annual Precipitation Days | 63.4 |
| Average Annual Precipitation | 35.5 |
| Average Annual Snowfall | 35.1 |
Average High
Days of Rain
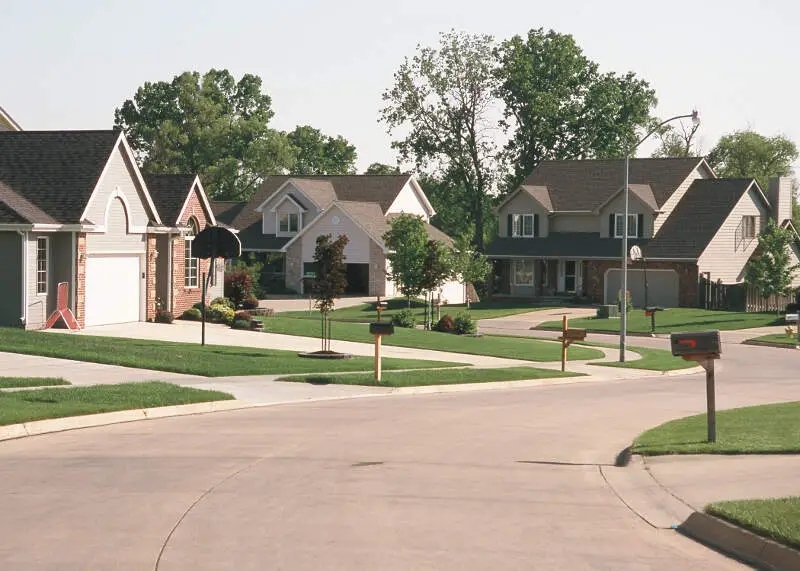
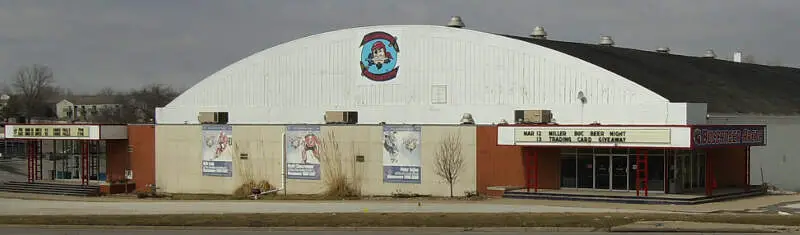
Urbandale, IA Photos

Rankings for Urbandale in Iowa


Locations Around Urbandale
Map Of Urbandale, IA
Best Places Around Urbandale
Ankeny, IA
Population 70,542
Clive, IA
Population 18,776
West Des Moines, IA
Population 69,893
Johnston, IA
Population 24,196
Norwalk, IA
Population 13,610
Altoona, IA
Population 20,592
Waukee, IA
Population 26,974
Grimes, IA
Population 15,810
Pleasant Hill, IA
Population 10,796
Des Moines, IA
Population 212,464
Urbandale Demographics And Statistics
Population over time in Urbandale
The current population in Urbandale is 46,026. The population has increased 22.7% from 2010.
| Year | Population | % Change |
|---|---|---|
| 2023 | 46,026 | 1.0% |
| 2022 | 45,591 | 1.2% |
| 2021 | 45,037 | 2.6% |
| 2020 | 43,879 | 1.0% |
| 2019 | 43,441 | 1.3% |
| 2018 | 42,881 | 1.6% |
| 2017 | 42,222 | 1.5% |
| 2016 | 41,578 | -1.2% |
| 2015 | 42,099 | 2.3% |
| 2014 | 41,157 | 2.2% |
| 2013 | 40,277 | 2.2% |
| 2012 | 39,426 | 2.3% |
| 2011 | 38,542 | 2.8% |
| 2010 | 37,503 | - |
Race / Ethnicity in Urbandale
Urbandale is:
79.8% White with 36,742 White residents.
5.4% African American with 2,502 African American residents.
0.1% American Indian with 50 American Indian residents.
5.4% Asian with 2,498 Asian residents.
0.0% Hawaiian with 0 Hawaiian residents.
0.4% Other with 173 Other residents.
2.5% Two Or More with 1,134 Two Or More residents.
6.4% Hispanic with 2,927 Hispanic residents.
| Race | Urbandale | IA | USA |
|---|---|---|---|
| White | 79.8% | 83.1% | 58.2% |
| African American | 5.4% | 3.8% | 12.0% |
| American Indian | 0.1% | 0.2% | 0.5% |
| Asian | 5.4% | 2.4% | 5.7% |
| Hawaiian | 0.0% | 0.1% | 0.2% |
| Other | 0.4% | 0.2% | 0.5% |
| Two Or More | 2.5% | 3.2% | 3.9% |
| Hispanic | 6.4% | 7.0% | 19.0% |
Gender in Urbandale
Urbandale is 48.7% female with 22,430 female residents.
Urbandale is 51.3% male with 23,595 male residents.
| Gender | Urbandale | IA | USA |
|---|---|---|---|
| Female | 48.7% | 49.9% | 50.5% |
| Male | 51.3% | 50.1% | 49.5% |
Highest level of educational attainment in Urbandale for adults over 25
3.0% of adults in Urbandale completed < 9th grade.
2.0% of adults in Urbandale completed 9-12th grade.
18.0% of adults in Urbandale completed high school / ged.
15.0% of adults in Urbandale completed some college.
10.0% of adults in Urbandale completed associate's degree.
34.0% of adults in Urbandale completed bachelor's degree.
12.0% of adults in Urbandale completed master's degree.
4.0% of adults in Urbandale completed professional degree.
2.0% of adults in Urbandale completed doctorate degree.
| Education | Urbandale | IA | USA |
|---|---|---|---|
| < 9th Grade | 3.0% | 3.0% | 5.0% |
| 9-12th Grade | 2.0% | 4.0% | 6.0% |
| High School / GED | 18.0% | 30.0% | 26.0% |
| Some College | 15.0% | 20.0% | 19.0% |
| Associate's Degree | 10.0% | 12.0% | 9.0% |
| Bachelor's Degree | 34.0% | 21.0% | 21.0% |
| Master's Degree | 12.0% | 7.0% | 10.0% |
| Professional Degree | 4.0% | 2.0% | 2.0% |
| Doctorate Degree | 2.0% | 1.0% | 2.0% |
Household Income For Urbandale, Iowa
2.7% of households in Urbandale earn Less than $10,000.
0.5% of households in Urbandale earn $10,000 to $14,999.
3.7% of households in Urbandale earn $15,000 to $24,999.
3.2% of households in Urbandale earn $25,000 to $34,999.
8.5% of households in Urbandale earn $35,000 to $49,999.
11.8% of households in Urbandale earn $50,000 to $74,999.
14.1% of households in Urbandale earn $75,000 to $99,999.
20.7% of households in Urbandale earn $100,000 to $149,999.
13.4% of households in Urbandale earn $150,000 to $199,999.
21.3% of households in Urbandale earn $200,000 or more.
| Income | Urbandale | IA | USA |
|---|---|---|---|
| Less than $10,000 | 2.7% | 4.0% | 4.9% |
| $10,000 to $14,999 | 0.5% | 3.4% | 3.6% |
| $15,000 to $24,999 | 3.7% | 7.0% | 6.6% |
| $25,000 to $34,999 | 3.2% | 7.3% | 6.8% |
| $35,000 to $49,999 | 8.5% | 11.7% | 10.4% |
| $50,000 to $74,999 | 11.8% | 17.8% | 15.7% |
| $75,000 to $99,999 | 14.1% | 14.1% | 12.7% |
| $100,000 to $149,999 | 20.7% | 18.4% | 17.4% |
| $150,000 to $199,999 | 13.4% | 8.4% | 9.3% |
| $200,000 or more | 21.3% | 8.0% | 12.6% |


