El Dorado, KS
Demographics And Statistics
Living In El Dorado, Kansas Summary
Life in El Dorado research summary. HomeSnacks has been using Saturday Night Science to research the quality of life in El Dorado over the past nine years using Census, FBI, Zillow, and other primary data sources. Based on the most recently available data, we found the following about life in El Dorado:
The population in El Dorado is 12,882.
The median home value in El Dorado is $168,066.
The median income in El Dorado is $54,828.
The cost of living in El Dorado is 87 which is 0.9x lower than the national average.
The median rent in El Dorado is $877.
The unemployment rate in El Dorado is 4.5%.
The poverty rate in El Dorado is 21.4%.
The average high in El Dorado is 67.8° and the average low is 45.3°.
El Dorado SnackAbility
Overall SnackAbility
El Dorado, KS Crime Report
Crime in El Dorado summary. We use data from the FBI to determine the crime rates in El Dorado. Key points include:
There were 219 total crimes in El Dorado in the last reporting year.
The overall crime rate per 100,000 people in El Dorado is 1,692.3 / 100k people.
The violent crime rate per 100,000 people in El Dorado is 270.5 / 100k people.
The property crime rate per 100,000 people in El Dorado is 1,421.8 / 100k people.
Overall, crime in El Dorado is -20.15% below the national average.
Total Crimes
Below National Average
Crime In El Dorado Comparison Table
| Statistic | Count Raw |
El Dorado / 100k People |
Kansas / 100k People |
National / 100k People |
|---|---|---|---|---|
| Total Crimes Per 100K | 219 | 1,692.3 | 2,395.1 | 2,119.2 |
| Violent Crime | 35 | 270.5 | 438.7 | 359.0 |
| Murder | 1 | 7.7 | 3.8 | 5.0 |
| Robbery | 3 | 23.2 | 30.9 | 61.0 |
| Aggravated Assault | 25 | 193.2 | 359.9 | 256.0 |
| Property Crime | 184 | 1,421.8 | 1,956.4 | 1,760.0 |
| Burglary | 21 | 162.3 | 261.6 | 229.0 |
| Larceny | 137 | 1,058.7 | 1,458.5 | 1,272.0 |
| Car Theft | 26 | 200.9 | 236.3 | 259.0 |
El Dorado, KS Cost Of Living
Cost of living in El Dorado summary. We use data on the cost of living to determine how expensive it is to live in El Dorado. Real estate prices drive most of the variance in cost of living around Kansas. Key points include:
The cost of living in El Dorado is 87 with 100 being average.
The cost of living in El Dorado is 0.9x lower than the national average.
The median home value in El Dorado is $168,066.
The median income in El Dorado is $54,828.
El Dorado's Overall Cost Of Living
Lower Than The National Average
Cost Of Living In El Dorado Comparison Table
| Living Expense | El Dorado | Kansas | National Average | |
|---|---|---|---|---|
| Overall | 87 | 87 | 100 | |
| Services | 98 | 93 | 100 | |
| Groceries | 99 | 98 | 100 | |
| Health | 93 | 98 | 100 | |
| Housing | 57 | 78 | 100 | |
| Transportation | 91 | 88 | 100 | |
| Utilities | 105 | 109 | 100 | |
El Dorado, KS Weather
The average high in El Dorado is 67.8° and the average low is 45.3°.
There are 60.1 days of precipitation each year.
Expect an average of 36.8 inches of precipitation each year with 6.9 inches of snow.
| Stat | El Dorado |
|---|---|
| Average Annual High | 67.8 |
| Average Annual Low | 45.3 |
| Annual Precipitation Days | 60.1 |
| Average Annual Precipitation | 36.8 |
| Average Annual Snowfall | 6.9 |
Average High
Days of Rain
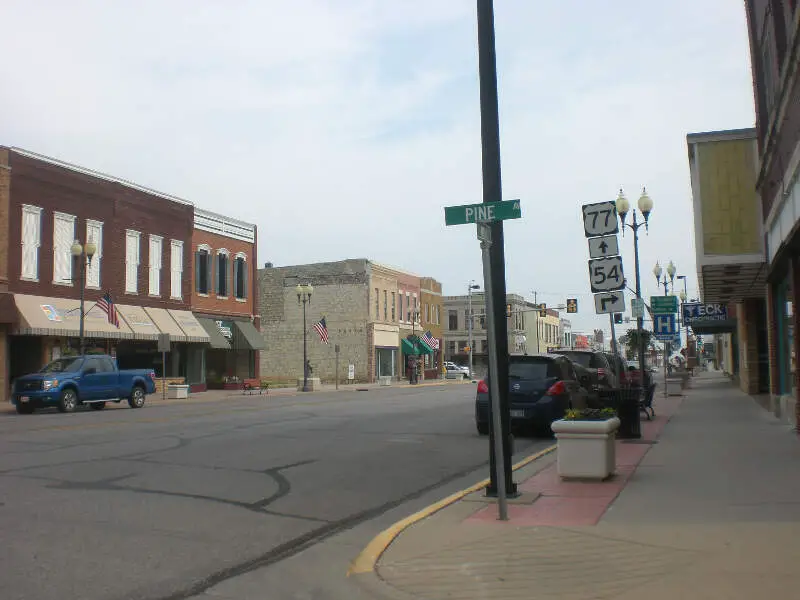
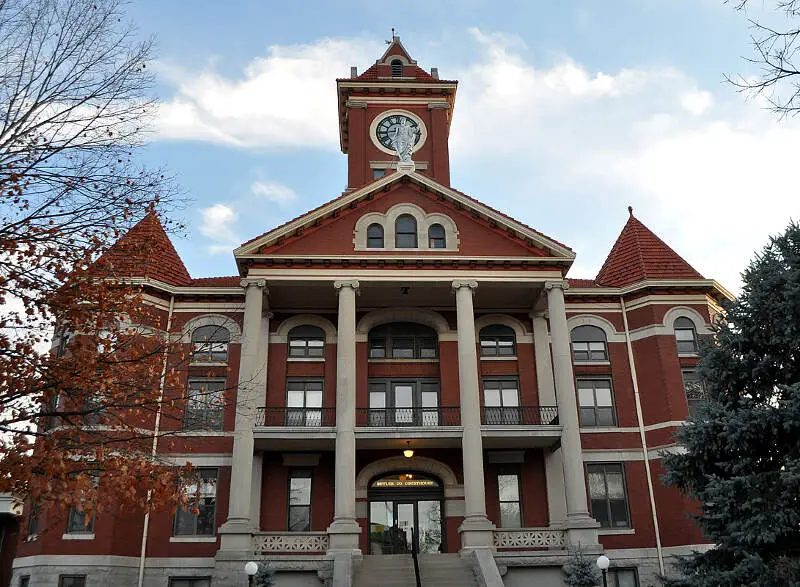
El Dorado, KS Photos
Rankings for El Dorado in Kansas


Locations Around El Dorado
Map Of El Dorado, KS
Best Places Around El Dorado
Rose Hill, KS
Population 4,353
Bel Aire, KS
Population 8,654
Goddard, KS
Population 5,361
Andover, KS
Population 15,508
Mulvane, KS
Population 5,829
Maize, KS
Population 5,990
Derby, KS
Population 25,801
Valley Center, KS
Population 8,937
Winfield, KS
Population 11,731
Haysville, KS
Population 11,117
El Dorado Demographics And Statistics
Population over time in El Dorado
The current population in El Dorado is 12,882. The population has decreased -0.9% from 2010.
| Year | Population | % Change |
|---|---|---|
| 2023 | 12,882 | 0.0% |
| 2022 | 12,882 | 0.2% |
| 2021 | 12,855 | -0.9% |
| 2020 | 12,976 | -0.1% |
| 2019 | 12,988 | 0.0% |
| 2018 | 12,988 | -0.1% |
| 2017 | 13,003 | -0.8% |
| 2016 | 13,102 | 1.5% |
| 2015 | 12,910 | -0.2% |
| 2014 | 12,931 | -0.2% |
| 2013 | 12,958 | -0.2% |
| 2012 | 12,988 | -0.1% |
| 2011 | 13,006 | 0.0% |
| 2010 | 13,004 | - |
Race / Ethnicity in El Dorado
El Dorado is:
88.6% White with 11,412 White residents.
1.1% African American with 137 African American residents.
0.5% American Indian with 63 American Indian residents.
1.3% Asian with 170 Asian residents.
0.0% Hawaiian with 0 Hawaiian residents.
0.1% Other with 16 Other residents.
3.4% Two Or More with 444 Two Or More residents.
5.0% Hispanic with 640 Hispanic residents.
| Race | El Dorado | KS | USA |
|---|---|---|---|
| White | 88.6% | 73.4% | 58.2% |
| African American | 1.1% | 5.3% | 12.0% |
| American Indian | 0.5% | 0.4% | 0.5% |
| Asian | 1.3% | 2.9% | 5.7% |
| Hawaiian | 0.0% | 0.1% | 0.2% |
| Other | 0.1% | 0.4% | 0.5% |
| Two Or More | 3.4% | 4.3% | 3.9% |
| Hispanic | 5.0% | 13.3% | 19.0% |
Gender in El Dorado
El Dorado is 50.7% female with 6,530 female residents.
El Dorado is 49.3% male with 6,352 male residents.
| Gender | El Dorado | KS | USA |
|---|---|---|---|
| Female | 50.7% | 49.8% | 50.5% |
| Male | 49.3% | 50.2% | 49.5% |
Highest level of educational attainment in El Dorado for adults over 25
1.0% of adults in El Dorado completed < 9th grade.
5.0% of adults in El Dorado completed 9-12th grade.
32.0% of adults in El Dorado completed high school / ged.
25.0% of adults in El Dorado completed some college.
11.0% of adults in El Dorado completed associate's degree.
18.0% of adults in El Dorado completed bachelor's degree.
7.0% of adults in El Dorado completed master's degree.
0.0% of adults in El Dorado completed professional degree.
1.0% of adults in El Dorado completed doctorate degree.
| Education | El Dorado | KS | USA |
|---|---|---|---|
| < 9th Grade | 1.0% | 3.0% | 5.0% |
| 9-12th Grade | 5.0% | 5.0% | 6.0% |
| High School / GED | 32.0% | 26.0% | 26.0% |
| Some College | 25.0% | 22.0% | 19.0% |
| Associate's Degree | 11.0% | 9.0% | 9.0% |
| Bachelor's Degree | 18.0% | 22.0% | 21.0% |
| Master's Degree | 7.0% | 10.0% | 10.0% |
| Professional Degree | 0.0% | 2.0% | 2.0% |
| Doctorate Degree | 1.0% | 1.0% | 2.0% |
Household Income For El Dorado, Kansas
7.5% of households in El Dorado earn Less than $10,000.
6.6% of households in El Dorado earn $10,000 to $14,999.
9.0% of households in El Dorado earn $15,000 to $24,999.
7.6% of households in El Dorado earn $25,000 to $34,999.
13.8% of households in El Dorado earn $35,000 to $49,999.
20.9% of households in El Dorado earn $50,000 to $74,999.
12.5% of households in El Dorado earn $75,000 to $99,999.
15.9% of households in El Dorado earn $100,000 to $149,999.
4.8% of households in El Dorado earn $150,000 to $199,999.
1.4% of households in El Dorado earn $200,000 or more.
| Income | El Dorado | KS | USA |
|---|---|---|---|
| Less than $10,000 | 7.5% | 4.4% | 4.9% |
| $10,000 to $14,999 | 6.6% | 3.3% | 3.6% |
| $15,000 to $24,999 | 9.0% | 6.7% | 6.6% |
| $25,000 to $34,999 | 7.6% | 7.8% | 6.8% |
| $35,000 to $49,999 | 13.8% | 11.5% | 10.4% |
| $50,000 to $74,999 | 20.9% | 17.8% | 15.7% |
| $75,000 to $99,999 | 12.5% | 13.5% | 12.7% |
| $100,000 to $149,999 | 15.9% | 17.7% | 17.4% |
| $150,000 to $199,999 | 4.8% | 8.4% | 9.3% |
| $200,000 or more | 1.4% | 8.8% | 12.6% |


