Overland Park, KS
Demographics And Statistics
Living In Overland Park, Kansas Summary
Life in Overland Park research summary. HomeSnacks has been using Saturday Night Science to research the quality of life in Overland Park over the past nine years using Census, FBI, Zillow, and other primary data sources. Based on the most recently available data, we found the following about life in Overland Park:
The population in Overland Park is 197,199.
The median home value in Overland Park is $459,584.
The median income in Overland Park is $103,838.
The cost of living in Overland Park is 112 which is 1.1x higher than the national average.
The median rent in Overland Park is $1,455.
The unemployment rate in Overland Park is 3.4%.
The poverty rate in Overland Park is 4.9%.
The average high in Overland Park is 65.1° and the average low is 45.3°.
Overland Park SnackAbility
Overall SnackAbility
Overland Park, KS Crime Report
Crime in Overland Park summary. We use data from the FBI to determine the crime rates in Overland Park. Key points include:
There were 3,831 total crimes in Overland Park in the last reporting year.
The overall crime rate per 100,000 people in Overland Park is 1,945.9 / 100k people.
The violent crime rate per 100,000 people in Overland Park is 184.4 / 100k people.
The property crime rate per 100,000 people in Overland Park is 1,761.5 / 100k people.
Overall, crime in Overland Park is -8.18% below the national average.
Total Crimes
Below National Average
Crime In Overland Park Comparison Table
| Statistic | Count Raw |
Overland Park / 100k People |
Kansas / 100k People |
National / 100k People |
|---|---|---|---|---|
| Total Crimes Per 100K | 3,831 | 1,945.9 | 2,395.1 | 2,119.2 |
| Violent Crime | 363 | 184.4 | 438.7 | 359.0 |
| Murder | 0 | 0.0 | 3.8 | 5.0 |
| Robbery | 38 | 19.3 | 30.9 | 61.0 |
| Aggravated Assault | 284 | 144.3 | 359.9 | 256.0 |
| Property Crime | 3,468 | 1,761.5 | 1,956.4 | 1,760.0 |
| Burglary | 220 | 111.7 | 261.6 | 229.0 |
| Larceny | 2,728 | 1,385.7 | 1,458.5 | 1,272.0 |
| Car Theft | 520 | 264.1 | 236.3 | 259.0 |
Overland Park, KS Cost Of Living
Cost of living in Overland Park summary. We use data on the cost of living to determine how expensive it is to live in Overland Park. Real estate prices drive most of the variance in cost of living around Kansas. Key points include:
The cost of living in Overland Park is 112 with 100 being average.
The cost of living in Overland Park is 1.1x higher than the national average.
The median home value in Overland Park is $459,584.
The median income in Overland Park is $103,838.
Overland Park's Overall Cost Of Living
Higher Than The National Average
Cost Of Living In Overland Park Comparison Table
| Living Expense | Overland Park | Kansas | National Average | |
|---|---|---|---|---|
| Overall | 112 | 87 | 100 | |
| Services | 90 | 93 | 100 | |
| Groceries | 98 | 98 | 100 | |
| Health | 86 | 98 | 100 | |
| Housing | 152 | 78 | 100 | |
| Transportation | 89 | 88 | 100 | |
| Utilities | 108 | 109 | 100 | |
Overland Park, KS Weather
The average high in Overland Park is 65.1° and the average low is 45.3°.
There are 65.3 days of precipitation each year.
Expect an average of 40.9 inches of precipitation each year with 14.6 inches of snow.
| Stat | Overland Park |
|---|---|
| Average Annual High | 65.1 |
| Average Annual Low | 45.3 |
| Annual Precipitation Days | 65.3 |
| Average Annual Precipitation | 40.9 |
| Average Annual Snowfall | 14.6 |
Average High
Days of Rain
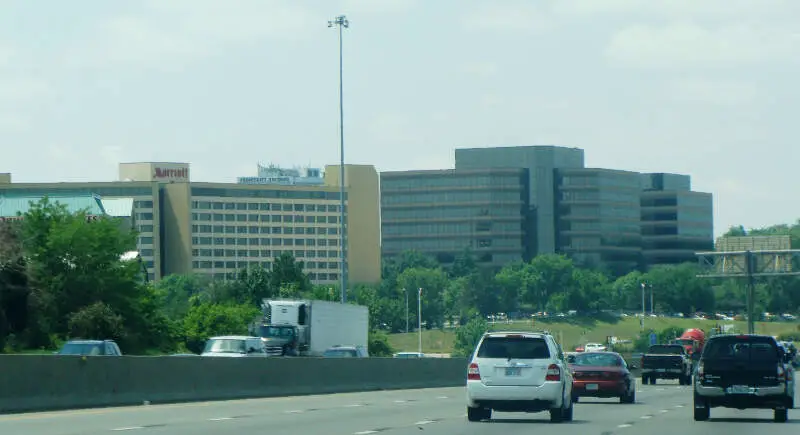
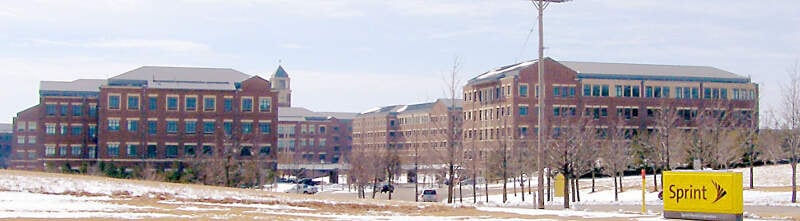
Overland Park, KS Photos
Rankings for Overland Park in Kansas


Locations Around Overland Park
Map Of Overland Park, KS
Best Places Around Overland Park
Lee's Summit, MO
Population 102,583
Leawood, KS
Population 33,844
Mission Hills, KS
Population 3,556
Fairway, KS
Population 4,177
Raymore, MO
Population 23,849
Olathe, KS
Population 143,720
Lenexa, KS
Population 57,986
Greenwood, MO
Population 6,000
Spring Hill, KS
Population 8,691
Shawnee, KS
Population 68,175
Overland Park Demographics And Statistics
Population over time in Overland Park
The current population in Overland Park is 197,199. The population has increased 15.6% from 2010.
| Year | Population | % Change |
|---|---|---|
| 2023 | 197,199 | 0.3% |
| 2022 | 196,676 | 0.7% |
| 2021 | 195,249 | 0.9% |
| 2020 | 193,412 | 1.3% |
| 2019 | 191,011 | 1.2% |
| 2018 | 188,687 | 1.4% |
| 2017 | 186,147 | 1.3% |
| 2016 | 183,775 | 1.3% |
| 2015 | 181,464 | 1.4% |
| 2014 | 178,945 | 1.4% |
| 2013 | 176,520 | 1.2% |
| 2012 | 174,503 | 1.2% |
| 2011 | 172,389 | 1.1% |
| 2010 | 170,515 | - |
Race / Ethnicity in Overland Park
Overland Park is:
73.9% White with 145,750 White residents.
5.3% African American with 10,416 African American residents.
0.1% American Indian with 256 American Indian residents.
8.7% Asian with 17,193 Asian residents.
0.0% Hawaiian with 75 Hawaiian residents.
0.3% Other with 541 Other residents.
3.6% Two Or More with 7,092 Two Or More residents.
8.1% Hispanic with 15,876 Hispanic residents.
| Race | Overland Park | KS | USA |
|---|---|---|---|
| White | 73.9% | 73.4% | 58.2% |
| African American | 5.3% | 5.3% | 12.0% |
| American Indian | 0.1% | 0.4% | 0.5% |
| Asian | 8.7% | 2.9% | 5.7% |
| Hawaiian | 0.0% | 0.1% | 0.2% |
| Other | 0.3% | 0.4% | 0.5% |
| Two Or More | 3.6% | 4.3% | 3.9% |
| Hispanic | 8.1% | 13.3% | 19.0% |
Gender in Overland Park
Overland Park is 50.5% female with 99,628 female residents.
Overland Park is 49.5% male with 97,571 male residents.
| Gender | Overland Park | KS | USA |
|---|---|---|---|
| Female | 50.5% | 49.8% | 50.5% |
| Male | 49.5% | 50.2% | 49.5% |
Highest level of educational attainment in Overland Park for adults over 25
1.0% of adults in Overland Park completed < 9th grade.
1.0% of adults in Overland Park completed 9-12th grade.
12.0% of adults in Overland Park completed high school / ged.
16.0% of adults in Overland Park completed some college.
6.0% of adults in Overland Park completed associate's degree.
38.0% of adults in Overland Park completed bachelor's degree.
19.0% of adults in Overland Park completed master's degree.
4.0% of adults in Overland Park completed professional degree.
3.0% of adults in Overland Park completed doctorate degree.
| Education | Overland Park | KS | USA |
|---|---|---|---|
| < 9th Grade | 1.0% | 3.0% | 5.0% |
| 9-12th Grade | 1.0% | 5.0% | 6.0% |
| High School / GED | 12.0% | 26.0% | 26.0% |
| Some College | 16.0% | 22.0% | 19.0% |
| Associate's Degree | 6.0% | 9.0% | 9.0% |
| Bachelor's Degree | 38.0% | 22.0% | 21.0% |
| Master's Degree | 19.0% | 10.0% | 10.0% |
| Professional Degree | 4.0% | 2.0% | 2.0% |
| Doctorate Degree | 3.0% | 1.0% | 2.0% |
Household Income For Overland Park, Kansas
2.6% of households in Overland Park earn Less than $10,000.
1.6% of households in Overland Park earn $10,000 to $14,999.
3.4% of households in Overland Park earn $15,000 to $24,999.
4.7% of households in Overland Park earn $25,000 to $34,999.
7.2% of households in Overland Park earn $35,000 to $49,999.
15.0% of households in Overland Park earn $50,000 to $74,999.
13.7% of households in Overland Park earn $75,000 to $99,999.
20.2% of households in Overland Park earn $100,000 to $149,999.
12.4% of households in Overland Park earn $150,000 to $199,999.
19.3% of households in Overland Park earn $200,000 or more.
| Income | Overland Park | KS | USA |
|---|---|---|---|
| Less than $10,000 | 2.6% | 4.4% | 4.9% |
| $10,000 to $14,999 | 1.6% | 3.3% | 3.6% |
| $15,000 to $24,999 | 3.4% | 6.7% | 6.6% |
| $25,000 to $34,999 | 4.7% | 7.8% | 6.8% |
| $35,000 to $49,999 | 7.2% | 11.5% | 10.4% |
| $50,000 to $74,999 | 15.0% | 17.8% | 15.7% |
| $75,000 to $99,999 | 13.7% | 13.5% | 12.7% |
| $100,000 to $149,999 | 20.2% | 17.7% | 17.4% |
| $150,000 to $199,999 | 12.4% | 8.4% | 9.3% |
| $200,000 or more | 19.3% | 8.8% | 12.6% |


