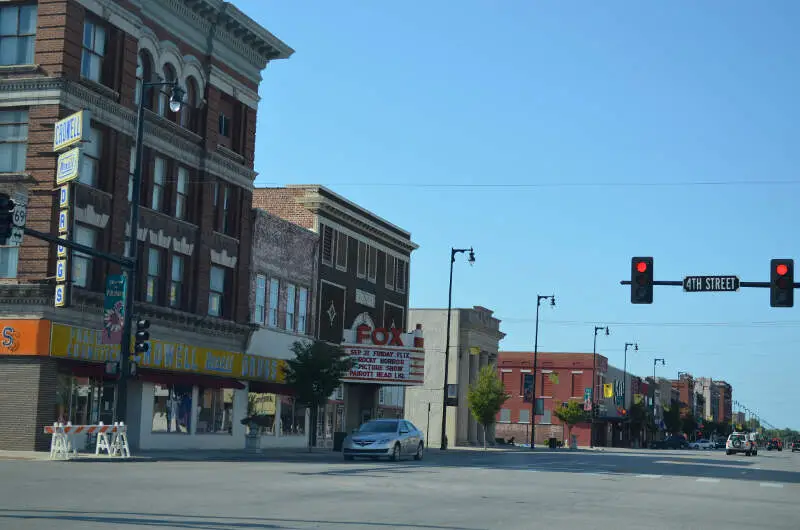
Pittsburg, KS
Demographics And Statistics
Living In Pittsburg, Kansas Summary
Life in Pittsburg research summary. HomeSnacks has been using Saturday Night Science to research the quality of life in Pittsburg over the past nine years using Census, FBI, Zillow, and other primary data sources. Based on the most recently available data, we found the following about life in Pittsburg:
The population in Pittsburg is 20,606.
The median home value in Pittsburg is $131,293.
The median income in Pittsburg is $40,220.
The cost of living in Pittsburg is 81 which is 0.8x lower than the national average.
The median rent in Pittsburg is $840.
The unemployment rate in Pittsburg is 3.6%.
The poverty rate in Pittsburg is 29.4%.
The average high in Pittsburg is 67.7° and the average low is 46.3°.
Pittsburg SnackAbility
Overall SnackAbility
Pittsburg, KS Crime Report
Crime in Pittsburg summary. We use data from the FBI to determine the crime rates in Pittsburg. Key points include:
There were 790 total crimes in Pittsburg in the last reporting year.
The overall crime rate per 100,000 people in Pittsburg is 3,860.2 / 100k people.
The violent crime rate per 100,000 people in Pittsburg is 366.5 / 100k people.
The property crime rate per 100,000 people in Pittsburg is 3,493.8 / 100k people.
Overall, crime in Pittsburg is 82.15% above the national average.
Total Crimes
Above National Average
Crime In Pittsburg Comparison Table
| Statistic | Count Raw |
Pittsburg / 100k People |
Kansas / 100k People |
National / 100k People |
|---|---|---|---|---|
| Total Crimes Per 100K | 790 | 3,860.2 | 2,395.1 | 2,119.2 |
| Violent Crime | 75 | 366.5 | 438.7 | 359.0 |
| Murder | 1 | 4.9 | 3.8 | 5.0 |
| Robbery | 6 | 29.3 | 30.9 | 61.0 |
| Aggravated Assault | 60 | 293.2 | 359.9 | 256.0 |
| Property Crime | 715 | 3,493.8 | 1,956.4 | 1,760.0 |
| Burglary | 72 | 351.8 | 261.6 | 229.0 |
| Larceny | 579 | 2,829.2 | 1,458.5 | 1,272.0 |
| Car Theft | 64 | 312.7 | 236.3 | 259.0 |
Pittsburg, KS Cost Of Living
Cost of living in Pittsburg summary. We use data on the cost of living to determine how expensive it is to live in Pittsburg. Real estate prices drive most of the variance in cost of living around Kansas. Key points include:
The cost of living in Pittsburg is 81 with 100 being average.
The cost of living in Pittsburg is 0.8x lower than the national average.
The median home value in Pittsburg is $131,293.
The median income in Pittsburg is $40,220.
Pittsburg's Overall Cost Of Living
Lower Than The National Average
Cost Of Living In Pittsburg Comparison Table
| Living Expense | Pittsburg | Kansas | National Average | |
|---|---|---|---|---|
| Overall | 81 | 87 | 100 | |
| Services | 88 | 93 | 100 | |
| Groceries | 95 | 98 | 100 | |
| Health | 87 | 98 | 100 | |
| Housing | 56 | 78 | 100 | |
| Transportation | 89 | 88 | 100 | |
| Utilities | 103 | 109 | 100 | |
Pittsburg, KS Weather
The average high in Pittsburg is 67.7° and the average low is 46.3°.
There are 68.3 days of precipitation each year.
Expect an average of 45.8 inches of precipitation each year with 11.2 inches of snow.
| Stat | Pittsburg |
|---|---|
| Average Annual High | 67.7 |
| Average Annual Low | 46.3 |
| Annual Precipitation Days | 68.3 |
| Average Annual Precipitation | 45.8 |
| Average Annual Snowfall | 11.2 |
Average High
Days of Rain
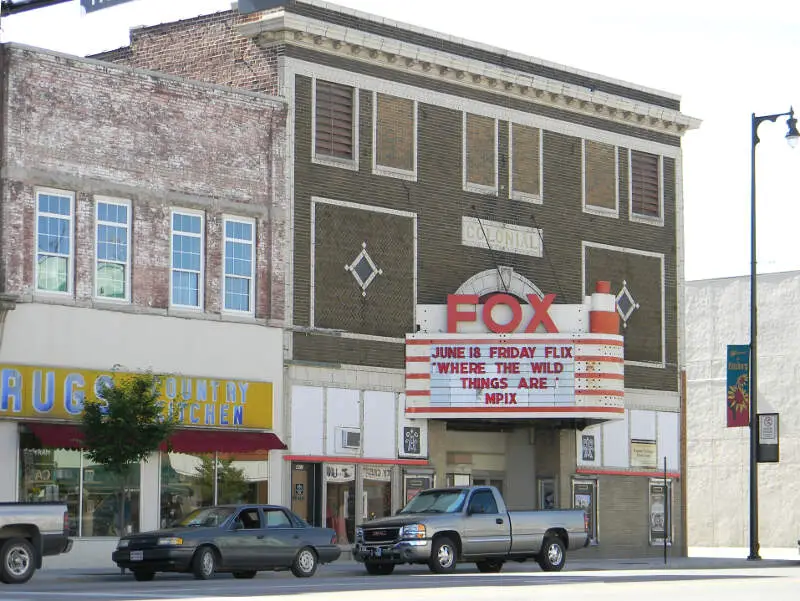
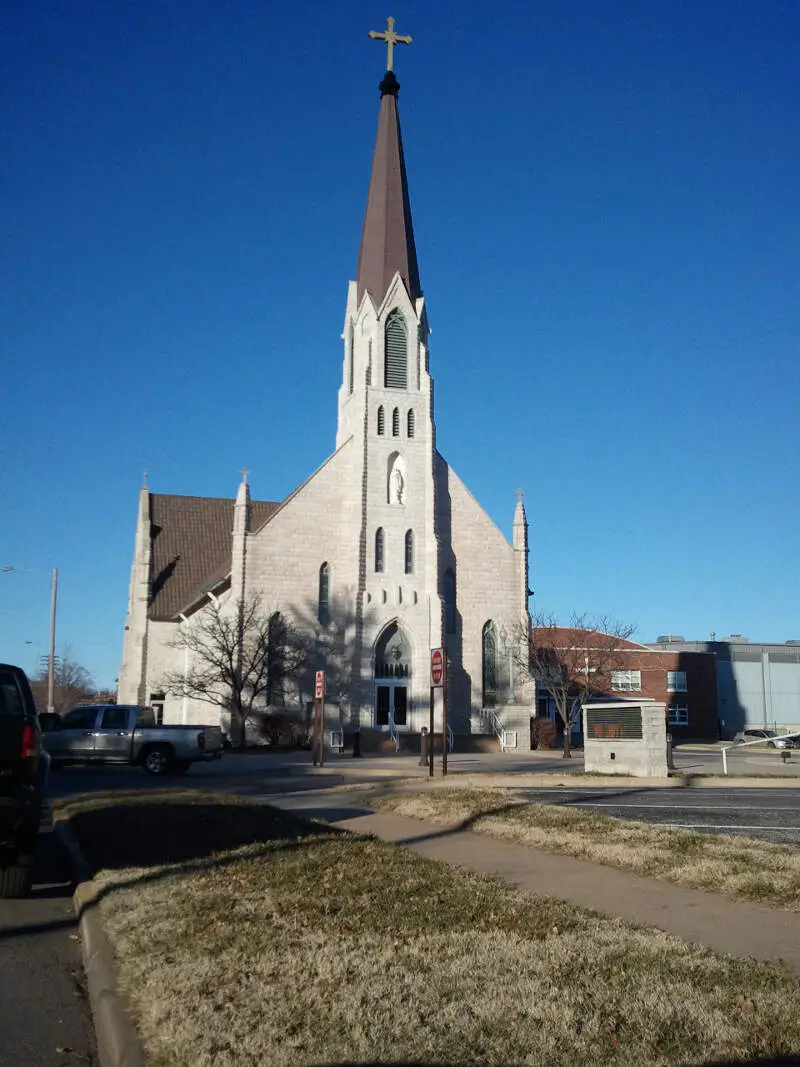
Pittsburg, KS Photos
1 Reviews & Comments About Pittsburg
/5

Diarrhea Sapian - None
I lived in Pittsburg and first week my garage was robbed blind.
Rankings for Pittsburg in Kansas


Locations Around Pittsburg
Map Of Pittsburg, KS
Best Places Around Pittsburg
Carl Junction, MO
Population 8,257
Neosho, MO
Population 12,857
Frontenac, KS
Population 3,381
Carthage, MO
Population 15,513
Joplin, MO
Population 52,218
Baxter Springs, KS
Population 3,863
Nevada, MO
Population 7,998
Miami, OK
Population 12,960
Pittsburg Demographics And Statistics
Population over time in Pittsburg
The current population in Pittsburg is 20,606. The population has increased 2.7% from 2010.
| Year | Population | % Change |
|---|---|---|
| 2023 | 20,606 | -0.0% |
| 2022 | 20,610 | -0.3% |
| 2021 | 20,667 | 2.8% |
| 2020 | 20,096 | -0.4% |
| 2019 | 20,171 | -0.5% |
| 2018 | 20,280 | 0.0% |
| 2017 | 20,278 | -0.6% |
| 2016 | 20,399 | 0.1% |
| 2015 | 20,382 | 0.2% |
| 2014 | 20,336 | 0.3% |
| 2013 | 20,282 | 0.4% |
| 2012 | 20,197 | 0.3% |
| 2011 | 20,137 | 0.4% |
| 2010 | 20,060 | - |
Race / Ethnicity in Pittsburg
Pittsburg is:
77.8% White with 16,032 White residents.
2.8% African American with 571 African American residents.
0.5% American Indian with 108 American Indian residents.
2.9% Asian with 589 Asian residents.
0.3% Hawaiian with 56 Hawaiian residents.
0.1% Other with 11 Other residents.
3.7% Two Or More with 761 Two Or More residents.
12.0% Hispanic with 2,478 Hispanic residents.
| Race | Pittsburg | KS | USA |
|---|---|---|---|
| White | 77.8% | 73.4% | 58.2% |
| African American | 2.8% | 5.3% | 12.0% |
| American Indian | 0.5% | 0.4% | 0.5% |
| Asian | 2.9% | 2.9% | 5.7% |
| Hawaiian | 0.3% | 0.1% | 0.2% |
| Other | 0.1% | 0.4% | 0.5% |
| Two Or More | 3.7% | 4.3% | 3.9% |
| Hispanic | 12.0% | 13.3% | 19.0% |
Gender in Pittsburg
Pittsburg is 49.5% female with 10,194 female residents.
Pittsburg is 50.5% male with 10,412 male residents.
| Gender | Pittsburg | KS | USA |
|---|---|---|---|
| Female | 49.5% | 49.8% | 50.5% |
| Male | 50.5% | 50.2% | 49.5% |
Highest level of educational attainment in Pittsburg for adults over 25
4.0% of adults in Pittsburg completed < 9th grade.
3.0% of adults in Pittsburg completed 9-12th grade.
29.0% of adults in Pittsburg completed high school / ged.
23.0% of adults in Pittsburg completed some college.
7.0% of adults in Pittsburg completed associate's degree.
21.0% of adults in Pittsburg completed bachelor's degree.
9.0% of adults in Pittsburg completed master's degree.
1.0% of adults in Pittsburg completed professional degree.
3.0% of adults in Pittsburg completed doctorate degree.
| Education | Pittsburg | KS | USA |
|---|---|---|---|
| < 9th Grade | 4.0% | 3.0% | 5.0% |
| 9-12th Grade | 3.0% | 5.0% | 6.0% |
| High School / GED | 29.0% | 26.0% | 26.0% |
| Some College | 23.0% | 22.0% | 19.0% |
| Associate's Degree | 7.0% | 9.0% | 9.0% |
| Bachelor's Degree | 21.0% | 22.0% | 21.0% |
| Master's Degree | 9.0% | 10.0% | 10.0% |
| Professional Degree | 1.0% | 2.0% | 2.0% |
| Doctorate Degree | 3.0% | 1.0% | 2.0% |
Household Income For Pittsburg, Kansas
8.7% of households in Pittsburg earn Less than $10,000.
7.8% of households in Pittsburg earn $10,000 to $14,999.
16.1% of households in Pittsburg earn $15,000 to $24,999.
10.9% of households in Pittsburg earn $25,000 to $34,999.
14.6% of households in Pittsburg earn $35,000 to $49,999.
19.5% of households in Pittsburg earn $50,000 to $74,999.
8.8% of households in Pittsburg earn $75,000 to $99,999.
7.8% of households in Pittsburg earn $100,000 to $149,999.
3.1% of households in Pittsburg earn $150,000 to $199,999.
2.7% of households in Pittsburg earn $200,000 or more.
| Income | Pittsburg | KS | USA |
|---|---|---|---|
| Less than $10,000 | 8.7% | 4.4% | 4.9% |
| $10,000 to $14,999 | 7.8% | 3.3% | 3.6% |
| $15,000 to $24,999 | 16.1% | 6.7% | 6.6% |
| $25,000 to $34,999 | 10.9% | 7.8% | 6.8% |
| $35,000 to $49,999 | 14.6% | 11.5% | 10.4% |
| $50,000 to $74,999 | 19.5% | 17.8% | 15.7% |
| $75,000 to $99,999 | 8.8% | 13.5% | 12.7% |
| $100,000 to $149,999 | 7.8% | 17.7% | 17.4% |
| $150,000 to $199,999 | 3.1% | 8.4% | 9.3% |
| $200,000 or more | 2.7% | 8.8% | 12.6% |


