Compare Wichita to…
Wichita SnackAbility
Overall SnackAbility
Crime in Wichita summary. We use data from the FBI to determine the crime rates in Wichita. Key points include:
There were 11,238 total crimes in Wichita in the last reporting year.
The overall crime rate per 100,000 people in Wichita is 2,841.6 / 100k people.
The violent crime rate per 100,000 people in Wichita is 538.6 / 100k people.
The property crime rate per 100,000 people in Wichita is 2,303.0 / 100k people.
Overall, crime in Wichita is 34.08% above the national average.
Total Crimes
Above National Average
Crime In Wichita Comparison Table
| Statistic | Count Raw |
Wichita / 100k People |
Kansas / 100k People |
National / 100k People |
|---|---|---|---|---|
| Total Crimes Per 100K | 11,238 | 2,841.6 | 2,395.1 | 2,119.2 |
| Violent Crime | 2,130 | 538.6 | 438.7 | 359.0 |
| Murder | 33 | 8.3 | 3.8 | 5.0 |
| Robbery | 197 | 49.8 | 30.9 | 61.0 |
| Aggravated Assault | 1,769 | 447.3 | 359.9 | 256.0 |
| Property Crime | 9,108 | 2,303.0 | 1,956.4 | 1,760.0 |
| Burglary | 1,039 | 262.7 | 261.6 | 229.0 |
| Larceny | 7,083 | 1,791.0 | 1,458.5 | 1,272.0 |
| Car Theft | 986 | 249.3 | 236.3 | 259.0 |
Source: FBI Uniform Crime Reporting (2024)
Cost of living in Wichita summary. We use data on the cost of living to determine how expensive it is to live in Wichita. Real estate prices drive most of the variance in cost of living around Kansas. Key points include:
The cost of living in Wichita is 92 with 100 being average.
The cost of living in Wichita is 0.9x lower than the national average.
The median home value in Wichita is $202,719.
The median income in Wichita is $64,620.
Wichita's Overall Cost Of Living
Lower Than The National Average
Cost Of Living In Wichita Comparison Table
| Living Expense | Wichita | Kansas | National Average |
|---|---|---|---|
| Overall | 92 | 91 | 100 |
| Services | 98 | 98 | 100 |
| Groceries | 92 | 97 | 100 |
| Health | 80 | 76 | 100 |
| Housing | 97 | 97 | 100 |
| Transportation | 95 | 93 | 100 |
| Utilities | 94 | 95 | 100 |
Source: Cost of living index, normalized to US average = 100
Wichita, KS Weather
The average high in Wichita is 67.6° and the average low is 46.0°.
There are 53.2 days of precipitation each year.
Expect an average of 34.5 inches of precipitation each year with 13.2 inches of snow.
| Stat | Wichita |
|---|---|
| Average Annual High | 67.6 |
| Average Annual Low | 46.0 |
| Annual Precipitation Days | 53.2 |
| Average Annual Precipitation | 34.5 |
| Average Annual Snowfall | 13.2 |
Average High
Days of Rain
Source: NOAA climate normals (30-year)
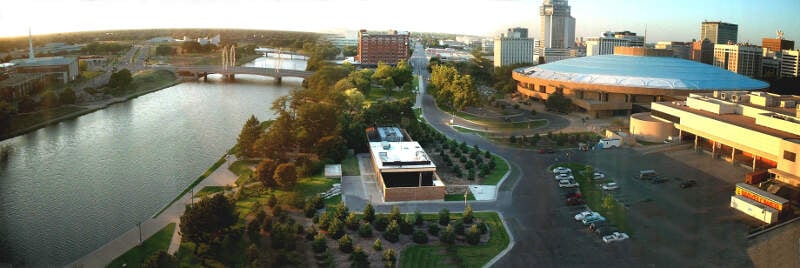
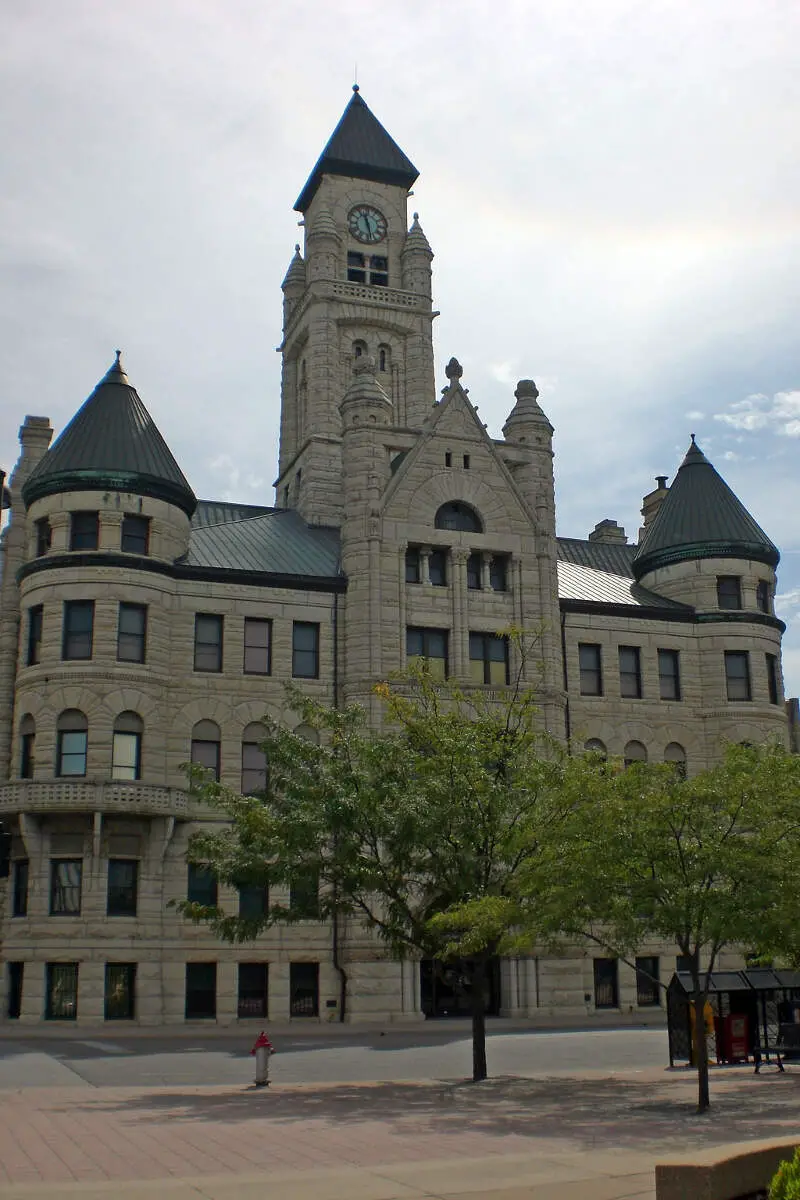
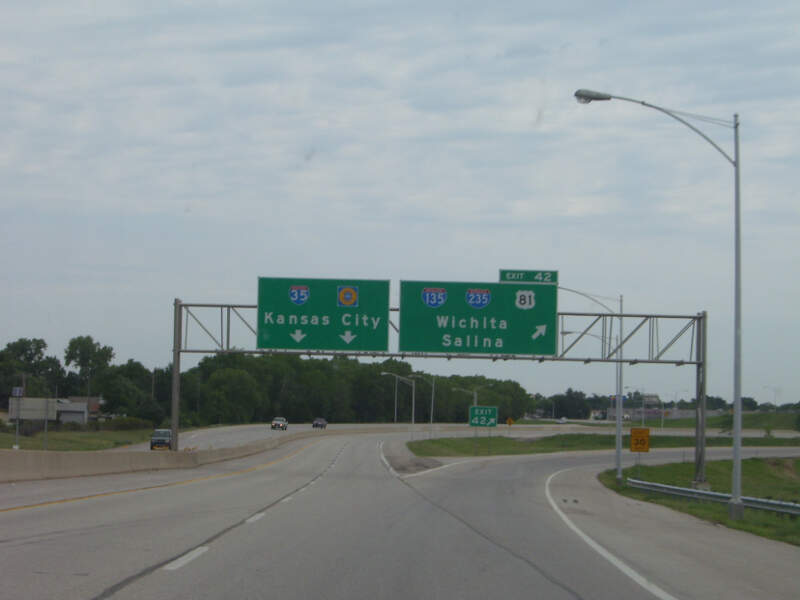
Wichita, KS Photos


3 Reviews & Comments About Wichita

I'm from Wichita and completely disagree with this. Wichita and many other cities in Kansas that were chosen as being the worst, are actually really cool cities to explore around.
I like Wichita because it's got the small town feel with most of the city amenities and culture.
The cost of living is very affordable. A family can easily afford a house from the income they make from the aircraft industry.
The bad side is that it could be a bit boring.
On the bright side, Vietnamese food is really good here.
As someone from Wichita KS I call BS. Most of the towns you have on here are tiny and don't have much to do. Kansas City KS is a small portion of KC. It goes into Missouri and there is a TON to do there!
As for Wichita, sure there is crime but not as much as they are saying. Wichita has small pockets of bad neighborhoods but what city doesn't.
Wichita has a thriving art and music scene. Always something to do here!
Rankings & Articles For Wichita


Locations Around Wichita
Map Of Wichita, KS
Best Places Around Wichita
Rose Hill, KS
Population 4,246
Bel Aire, KS
Population 9,043
Goddard, KS
Population 6,030
Andover, KS
Population 15,965
Mulvane, KS
Population 6,171
Maize, KS
Population 6,824
Derby, KS
Population 26,062
Valley Center, KS
Population 8,590
Haysville, KS
Population 11,117
Wichita Demographics And Statistics
Population over time in Wichita
The current population in Wichita is 397,945. The population has increased 6.5% from 2010.
| Year | Population | % Change |
|---|---|---|
| 2024 | 397,945 | 0.4% |
| 2023 | 396,488 | 0.1% |
| 2022 | 395,951 | 0.3% |
| 2021 | 394,574 | 1.0% |
| 2020 | 390,566 | 0.2% |
| 2019 | 389,877 | 0.1% |
| 2018 | 389,563 | 0.1% |
| 2017 | 389,054 | 0.3% |
| 2016 | 388,033 | 0.2% |
| 2015 | 387,147 | 0.4% |
| 2014 | 385,518 | 0.5% |
| 2013 | 383,703 | 0.7% |
| 2012 | 381,176 | 0.9% |
| 2011 | 377,906 | 1.1% |
| 2010 | 373,725 | - |
Race / Ethnicity in Wichita
See the full breakdown
Wichita is:
59.5% White with 236,619 White residents.
9.3% African American with 37,128 African American residents.
0.4% American Indian with 1,693 American Indian residents.
4.9% Asian with 19,467 Asian residents.
0.0% Hawaiian with 115 Hawaiian residents.
0.5% Other with 2,014 Other residents.
6.4% Two Or More with 25,417 Two Or More residents.
19.0% Hispanic with 75,492 Hispanic residents.
| Race | Wichita | KS | USA |
|---|---|---|---|
| White | 59.5% | 72.7% | 57.4% |
| African American | 9.3% | 5.2% | 11.9% |
| American Indian | 0.4% | 0.4% | 0.5% |
| Asian | 4.9% | 2.9% | 5.9% |
| Hawaiian | 0.0% | 0.1% | 0.2% |
| Other | 0.5% | 0.4% | 0.6% |
| Two Or More | 6.4% | 4.8% | 4.3% |
| Hispanic | 19.0% | 13.6% | 19.3% |
Gender in Wichita
See the full breakdown
Wichita is 50.3% female with 200,144 female residents.
Wichita is 49.7% male with 197,801 male residents.
| Gender | Wichita | KS | USA |
|---|---|---|---|
| Female | 50.3% | 49.8% | 50.5% |
| Male | 49.7% | 50.2% | 49.5% |
Highest level of educational attainment in Wichita for adults over 25
See the full breakdown
5.0% of adults in Wichita completed < 9th grade.
7.0% of adults in Wichita completed 9-12th grade.
26.0% of adults in Wichita completed high school / ged.
23.0% of adults in Wichita completed some college.
8.0% of adults in Wichita completed associate's degree.
19.0% of adults in Wichita completed bachelor's degree.
9.0% of adults in Wichita completed master's degree.
2.0% of adults in Wichita completed professional degree.
1.0% of adults in Wichita completed doctorate degree.
| Education | Wichita | KS | USA |
|---|---|---|---|
| < 9th Grade | 5.0% | 4.0% | 4.0% |
| 9-12th Grade | 7.0% | 5.0% | 6.0% |
| High School / GED | 26.0% | 25.0% | 26.0% |
| Some College | 23.0% | 22.0% | 19.0% |
| Associate's Degree | 8.0% | 9.0% | 9.0% |
| Bachelor's Degree | 19.0% | 22.0% | 22.0% |
| Master's Degree | 9.0% | 10.0% | 10.0% |
| Professional Degree | 2.0% | 2.0% | 2.0% |
| Doctorate Degree | 1.0% | 1.0% | 2.0% |
Household Income For Wichita, Kansas
See the full breakdown
5.3% of households in Wichita earn Less than $10,000.
4.1% of households in Wichita earn $10,000 to $14,999.
7.1% of households in Wichita earn $15,000 to $24,999.
9.6% of households in Wichita earn $25,000 to $34,999.
12.6% of households in Wichita earn $35,000 to $49,999.
18.0% of households in Wichita earn $50,000 to $74,999.
13.3% of households in Wichita earn $75,000 to $99,999.
15.6% of households in Wichita earn $100,000 to $149,999.
7.3% of households in Wichita earn $150,000 to $199,999.
7.1% of households in Wichita earn $200,000 or more.
| Income | Wichita | KS | USA |
|---|---|---|---|
| Less than $10,000 | 5.3% | 4.4% | 5.0% |
| $10,000 to $14,999 | 4.1% | 3.2% | 3.4% |
| $15,000 to $24,999 | 7.1% | 6.2% | 6.3% |
| $25,000 to $34,999 | 9.6% | 7.9% | 6.6% |
| $35,000 to $49,999 | 12.6% | 11.1% | 10.1% |
| $50,000 to $74,999 | 18.0% | 17.7% | 15.5% |
| $75,000 to $99,999 | 13.3% | 13.5% | 12.6% |
| $100,000 to $149,999 | 15.6% | 17.7% | 17.5% |
| $150,000 to $199,999 | 7.3% | 8.8% | 9.6% |
| $200,000 or more | 7.1% | 9.6% | 13.4% |
Source: U.S. Census ACS 5-year estimates (2024)


