Lyndon, KY
Demographics And Statistics
Living In Lyndon, Kentucky Summary
Life in Lyndon research summary. HomeSnacks has been using Saturday Night Science to research the quality of life in Lyndon over the past nine years using Census, FBI, Zillow, and other primary data sources. Based on the most recently available data, we found the following about life in Lyndon:
The population in Lyndon is 10,956.
The median home value in Lyndon is $322,056.
The median income in Lyndon is $65,392.
The cost of living in Lyndon is 102 which is 1.0x higher than the national average.
The median rent in Lyndon is $1,196.
The unemployment rate in Lyndon is 4.3%.
The poverty rate in Lyndon is 7.9%.
The average high in Lyndon is 66.8° and the average low is 46.2°.
Table Of Contents
Lyndon SnackAbility
Overall SnackAbility
Lyndon, KY Cost Of Living
Cost of living in Lyndon summary. We use data on the cost of living to determine how expensive it is to live in Lyndon. Real estate prices drive most of the variance in cost of living around Kentucky. Key points include:
The cost of living in Lyndon is 102 with 100 being average.
The cost of living in Lyndon is 1.0x higher than the national average.
The median home value in Lyndon is $322,056.
The median income in Lyndon is $65,392.
Lyndon's Overall Cost Of Living
Higher Than The National Average
Cost Of Living In Lyndon Comparison Table
| Living Expense | Lyndon | Kentucky | National Average | |
|---|---|---|---|---|
| Overall | 102 | 92 | 100 | |
| Services | 103 | 101 | 100 | |
| Groceries | 100 | 99 | 100 | |
| Health | 82 | 85 | 100 | |
| Housing | 111 | 71 | 100 | |
| Transportation | 93 | 94 | 100 | |
| Utilities | 106 | 105 | 100 | |
Lyndon, KY Weather
The average high in Lyndon is 66.8° and the average low is 46.2°.
There are 77.4 days of precipitation each year.
Expect an average of 46.1 inches of precipitation each year with 9.5 inches of snow.
| Stat | Lyndon |
|---|---|
| Average Annual High | 66.8 |
| Average Annual Low | 46.2 |
| Annual Precipitation Days | 77.4 |
| Average Annual Precipitation | 46.1 |
| Average Annual Snowfall | 9.5 |
Average High
Days of Rain
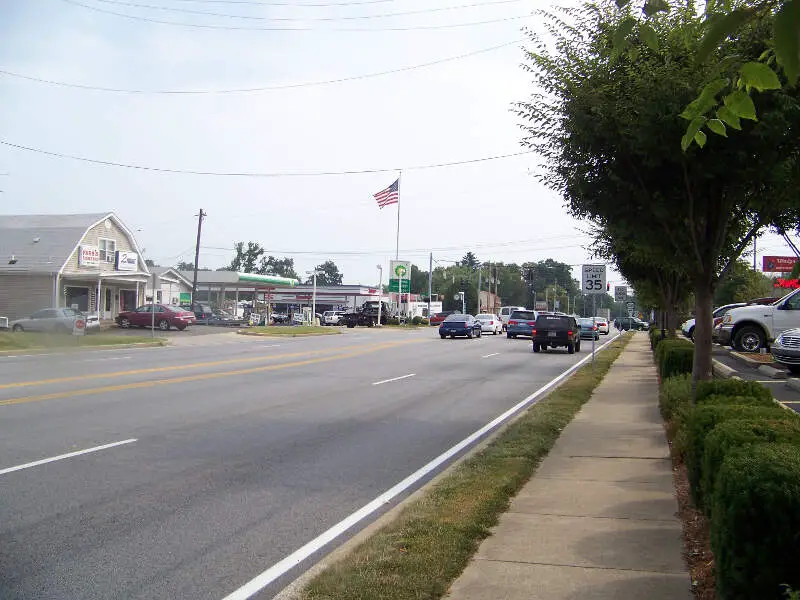
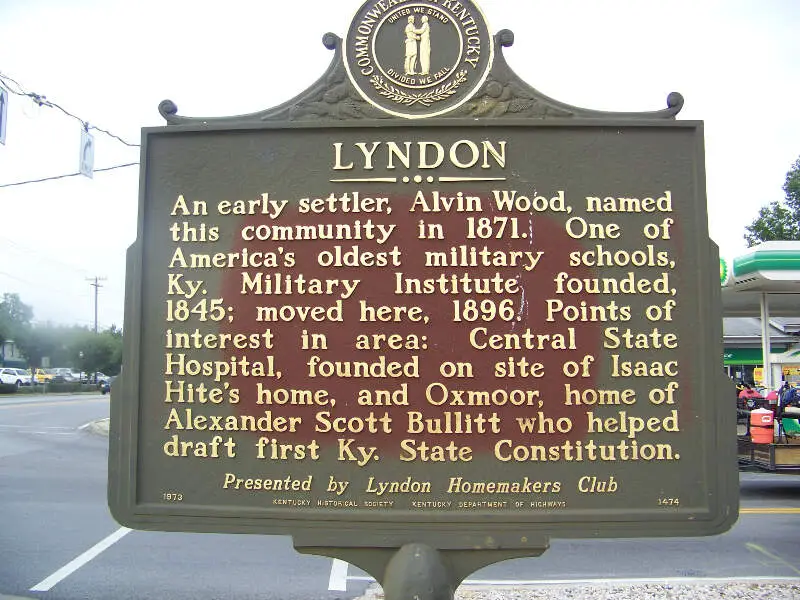
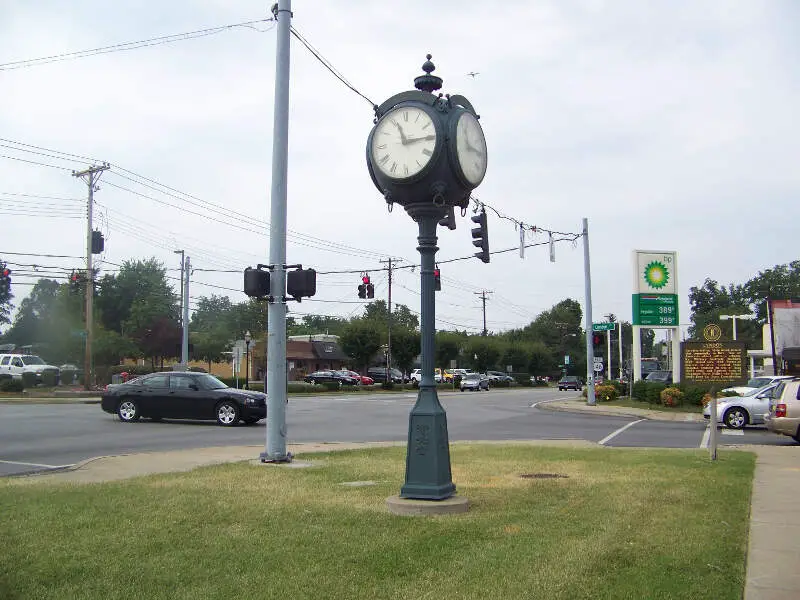
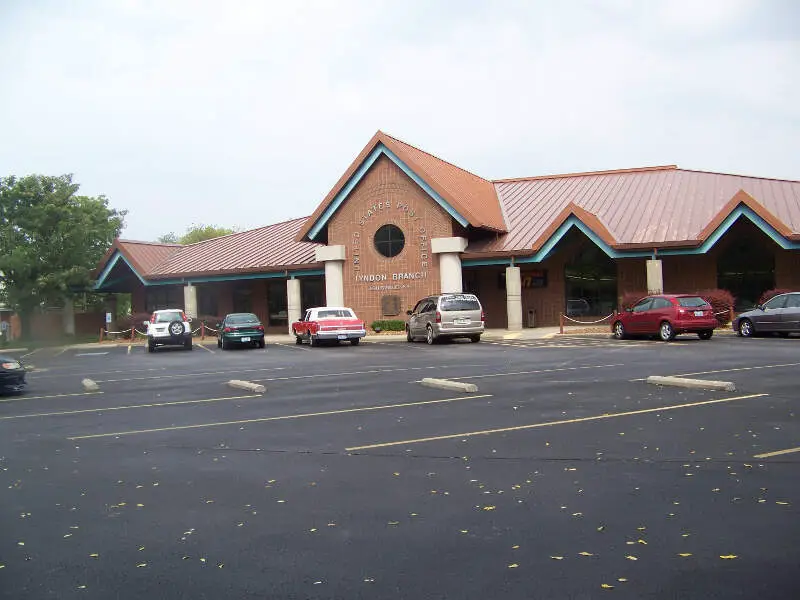
Lyndon, KY Photos
Rankings for Lyndon in Kentucky


Locations Around Lyndon
Map Of Lyndon, KY
Best Places Around Lyndon
Prospect, KY
Population 4,518
Hurstbourne, KY
Population 4,669
Jeffersontown, KY
Population 28,988
Douglass Hills, KY
Population 5,437
Middletown, KY
Population 9,622
Shelbyville, KY
Population 17,436
Buckner, KY
Population 3,786
St. Matthews, KY
Population 17,491
Lyndon Demographics And Statistics
Population over time in Lyndon
The current population in Lyndon is 10,956. The population has increased 1.6% from 2010.
| Year | Population | % Change |
|---|---|---|
| 2023 | 10,956 | -0.4% |
| 2022 | 10,997 | -0.3% |
| 2021 | 11,033 | -3.7% |
| 2020 | 11,451 | 0.2% |
| 2019 | 11,431 | 0.0% |
| 2018 | 11,427 | 0.3% |
| 2017 | 11,394 | 0.7% |
| 2016 | 11,310 | 0.6% |
| 2015 | 11,244 | 0.7% |
| 2014 | 11,167 | 0.6% |
| 2013 | 11,096 | 0.9% |
| 2012 | 10,992 | 0.8% |
| 2011 | 10,905 | 1.1% |
| 2010 | 10,786 | - |
Race / Ethnicity in Lyndon
Lyndon is:
72.5% White with 7,938 White residents.
15.9% African American with 1,741 African American residents.
0.1% American Indian with 12 American Indian residents.
2.2% Asian with 238 Asian residents.
0.0% Hawaiian with 0 Hawaiian residents.
0.2% Other with 22 Other residents.
5.3% Two Or More with 579 Two Or More residents.
3.9% Hispanic with 426 Hispanic residents.
| Race | Lyndon | KY | USA |
|---|---|---|---|
| White | 72.5% | 82.3% | 58.2% |
| African American | 15.9% | 7.8% | 12.0% |
| American Indian | 0.1% | 0.1% | 0.5% |
| Asian | 2.2% | 1.5% | 5.7% |
| Hawaiian | 0.0% | 0.1% | 0.2% |
| Other | 0.2% | 0.3% | 0.5% |
| Two Or More | 5.3% | 3.3% | 3.9% |
| Hispanic | 3.9% | 4.7% | 19.0% |
Gender in Lyndon
Lyndon is 53.4% female with 5,848 female residents.
Lyndon is 46.6% male with 5,108 male residents.
| Gender | Lyndon | KY | USA |
|---|---|---|---|
| Female | 53.4% | 50.5% | 50.5% |
| Male | 46.6% | 49.5% | 49.5% |
Highest level of educational attainment in Lyndon for adults over 25
4.0% of adults in Lyndon completed < 9th grade.
2.0% of adults in Lyndon completed 9-12th grade.
22.0% of adults in Lyndon completed high school / ged.
20.0% of adults in Lyndon completed some college.
8.0% of adults in Lyndon completed associate's degree.
26.0% of adults in Lyndon completed bachelor's degree.
13.0% of adults in Lyndon completed master's degree.
4.0% of adults in Lyndon completed professional degree.
1.0% of adults in Lyndon completed doctorate degree.
| Education | Lyndon | KY | USA |
|---|---|---|---|
| < 9th Grade | 4.0% | 4.0% | 5.0% |
| 9-12th Grade | 2.0% | 7.0% | 6.0% |
| High School / GED | 22.0% | 33.0% | 26.0% |
| Some College | 20.0% | 20.0% | 19.0% |
| Associate's Degree | 8.0% | 9.0% | 9.0% |
| Bachelor's Degree | 26.0% | 16.0% | 21.0% |
| Master's Degree | 13.0% | 8.0% | 10.0% |
| Professional Degree | 4.0% | 2.0% | 2.0% |
| Doctorate Degree | 1.0% | 1.0% | 2.0% |
Household Income For Lyndon, Kentucky
6.4% of households in Lyndon earn Less than $10,000.
1.4% of households in Lyndon earn $10,000 to $14,999.
6.6% of households in Lyndon earn $15,000 to $24,999.
10.3% of households in Lyndon earn $25,000 to $34,999.
11.8% of households in Lyndon earn $35,000 to $49,999.
22.9% of households in Lyndon earn $50,000 to $74,999.
11.2% of households in Lyndon earn $75,000 to $99,999.
15.9% of households in Lyndon earn $100,000 to $149,999.
8.6% of households in Lyndon earn $150,000 to $199,999.
4.9% of households in Lyndon earn $200,000 or more.
| Income | Lyndon | KY | USA |
|---|---|---|---|
| Less than $10,000 | 6.4% | 6.0% | 4.9% |
| $10,000 to $14,999 | 1.4% | 5.4% | 3.6% |
| $15,000 to $24,999 | 6.6% | 8.5% | 6.6% |
| $25,000 to $34,999 | 10.3% | 8.6% | 6.8% |
| $35,000 to $49,999 | 11.8% | 12.5% | 10.4% |
| $50,000 to $74,999 | 22.9% | 17.1% | 15.7% |
| $75,000 to $99,999 | 11.2% | 12.9% | 12.7% |
| $100,000 to $149,999 | 15.9% | 15.8% | 17.4% |
| $150,000 to $199,999 | 8.6% | 6.7% | 9.3% |
| $200,000 or more | 4.9% | 6.7% | 12.6% |


