Winchester, KY
Demographics And Statistics
Living In Winchester, Kentucky Summary
Life in Winchester research summary. HomeSnacks has been using Saturday Night Science to research the quality of life in Winchester over the past nine years using Census, FBI, Zillow, and other primary data sources. Based on the most recently available data, we found the following about life in Winchester:
The population in Winchester is 19,133.
The median home value in Winchester is $258,854.
The median income in Winchester is $57,653.
The cost of living in Winchester is 92 which is 0.9x lower than the national average.
The median rent in Winchester is $867.
The unemployment rate in Winchester is 5.2%.
The poverty rate in Winchester is 15.8%.
The average high in Winchester is 66.0° and the average low is 45.1°.
Winchester SnackAbility
Overall SnackAbility
Winchester, KY Crime Report
Crime in Winchester summary. We use data from the FBI to determine the crime rates in Winchester. Key points include:
There were 571 total crimes in Winchester in the last reporting year.
The overall crime rate per 100,000 people in Winchester is 2,961.2 / 100k people.
The violent crime rate per 100,000 people in Winchester is 165.9 / 100k people.
The property crime rate per 100,000 people in Winchester is 2,795.2 / 100k people.
Overall, crime in Winchester is 39.73% above the national average.
Total Crimes
Above National Average
Crime In Winchester Comparison Table
| Statistic | Count Raw |
Winchester / 100k People |
Kentucky / 100k People |
National / 100k People |
|---|---|---|---|---|
| Total Crimes Per 100K | 571 | 2,961.2 | 1,563.0 | 2,119.2 |
| Violent Crime | 32 | 165.9 | 213.1 | 359.0 |
| Murder | 0 | 0.0 | 6.1 | 5.0 |
| Robbery | 6 | 31.1 | 35.1 | 61.0 |
| Aggravated Assault | 16 | 83.0 | 139.5 | 256.0 |
| Property Crime | 539 | 2,795.2 | 1,349.9 | 1,760.0 |
| Burglary | 42 | 217.8 | 193.6 | 229.0 |
| Larceny | 470 | 2,437.4 | 930.2 | 1,272.0 |
| Car Theft | 27 | 140.0 | 226.2 | 259.0 |
Winchester, KY Cost Of Living
Cost of living in Winchester summary. We use data on the cost of living to determine how expensive it is to live in Winchester. Real estate prices drive most of the variance in cost of living around Kentucky. Key points include:
The cost of living in Winchester is 92 with 100 being average.
The cost of living in Winchester is 0.9x lower than the national average.
The median home value in Winchester is $258,854.
The median income in Winchester is $57,653.
Winchester's Overall Cost Of Living
Lower Than The National Average
Cost Of Living In Winchester Comparison Table
| Living Expense | Winchester | Kentucky | National Average | |
|---|---|---|---|---|
| Overall | 92 | 92 | 100 | |
| Services | 101 | 101 | 100 | |
| Groceries | 101 | 99 | 100 | |
| Health | 85 | 85 | 100 | |
| Housing | 74 | 71 | 100 | |
| Transportation | 92 | 94 | 100 | |
| Utilities | 104 | 105 | 100 | |
Winchester, KY Weather
The average high in Winchester is 66.0° and the average low is 45.1°.
There are 83.6 days of precipitation each year.
Expect an average of 45.6 inches of precipitation each year with 8.2 inches of snow.
| Stat | Winchester |
|---|---|
| Average Annual High | 66.0 |
| Average Annual Low | 45.1 |
| Annual Precipitation Days | 83.6 |
| Average Annual Precipitation | 45.6 |
| Average Annual Snowfall | 8.2 |
Average High
Days of Rain
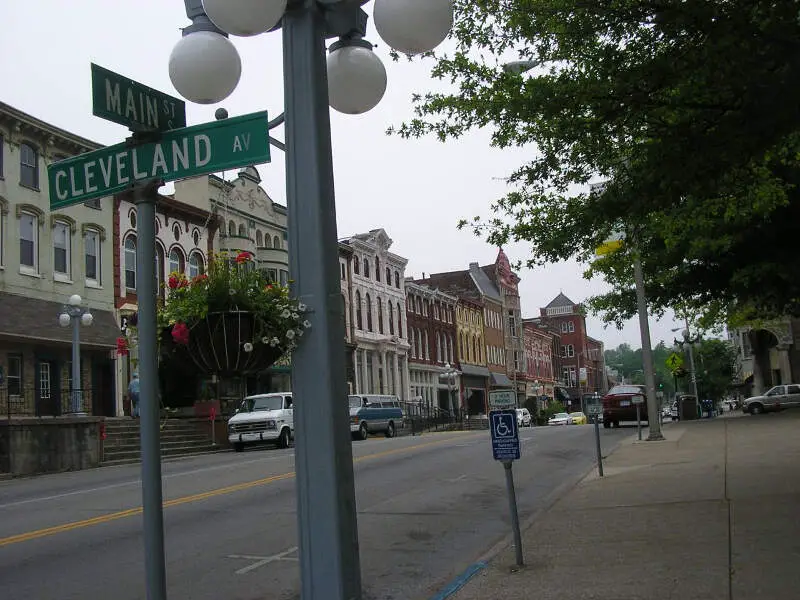
Winchester, KY Photos


Rankings for Winchester in Kentucky


Locations Around Winchester
Map Of Winchester, KY
Best Places Around Winchester
Williamstown, KY
Population 3,929
Frankfort, KY
Population 28,452
Berea, KY
Population 15,557
Georgetown, KY
Population 38,206
Nicholasville, KY
Population 31,625
Versailles, KY
Population 10,382
Lawrenceburg, KY
Population 11,838
Danville, KY
Population 17,235
Paris, KY
Population 10,107
Richmond, KY
Population 35,498
Winchester Demographics And Statistics
Population over time in Winchester
The current population in Winchester is 19,133. The population has increased 5.5% from 2010.
| Year | Population | % Change |
|---|---|---|
| 2023 | 19,133 | 0.3% |
| 2022 | 19,080 | 0.5% |
| 2021 | 18,993 | 2.6% |
| 2020 | 18,520 | 0.5% |
| 2019 | 18,429 | 0.1% |
| 2018 | 18,413 | 0.3% |
| 2017 | 18,364 | -0.2% |
| 2016 | 18,395 | 0.0% |
| 2015 | 18,388 | 0.1% |
| 2014 | 18,363 | -0.0% |
| 2013 | 18,366 | 0.3% |
| 2012 | 18,314 | 0.4% |
| 2011 | 18,245 | 0.6% |
| 2010 | 18,132 | - |
Race / Ethnicity in Winchester
Winchester is:
84.4% White with 16,155 White residents.
7.2% African American with 1,383 African American residents.
0.0% American Indian with 5 American Indian residents.
1.6% Asian with 298 Asian residents.
0.0% Hawaiian with 0 Hawaiian residents.
0.2% Other with 40 Other residents.
3.0% Two Or More with 577 Two Or More residents.
3.5% Hispanic with 675 Hispanic residents.
| Race | Winchester | KY | USA |
|---|---|---|---|
| White | 84.4% | 82.3% | 58.2% |
| African American | 7.2% | 7.8% | 12.0% |
| American Indian | 0.0% | 0.1% | 0.5% |
| Asian | 1.6% | 1.5% | 5.7% |
| Hawaiian | 0.0% | 0.1% | 0.2% |
| Other | 0.2% | 0.3% | 0.5% |
| Two Or More | 3.0% | 3.3% | 3.9% |
| Hispanic | 3.5% | 4.7% | 19.0% |
Gender in Winchester
Winchester is 54.1% female with 10,358 female residents.
Winchester is 45.9% male with 8,775 male residents.
| Gender | Winchester | KY | USA |
|---|---|---|---|
| Female | 54.1% | 50.5% | 50.5% |
| Male | 45.9% | 49.5% | 49.5% |
Highest level of educational attainment in Winchester for adults over 25
3.0% of adults in Winchester completed < 9th grade.
6.0% of adults in Winchester completed 9-12th grade.
36.0% of adults in Winchester completed high school / ged.
26.0% of adults in Winchester completed some college.
7.0% of adults in Winchester completed associate's degree.
14.0% of adults in Winchester completed bachelor's degree.
6.0% of adults in Winchester completed master's degree.
1.0% of adults in Winchester completed professional degree.
1.0% of adults in Winchester completed doctorate degree.
| Education | Winchester | KY | USA |
|---|---|---|---|
| < 9th Grade | 3.0% | 4.0% | 5.0% |
| 9-12th Grade | 6.0% | 7.0% | 6.0% |
| High School / GED | 36.0% | 33.0% | 26.0% |
| Some College | 26.0% | 20.0% | 19.0% |
| Associate's Degree | 7.0% | 9.0% | 9.0% |
| Bachelor's Degree | 14.0% | 16.0% | 21.0% |
| Master's Degree | 6.0% | 8.0% | 10.0% |
| Professional Degree | 1.0% | 2.0% | 2.0% |
| Doctorate Degree | 1.0% | 1.0% | 2.0% |
Household Income For Winchester, Kentucky
4.0% of households in Winchester earn Less than $10,000.
7.2% of households in Winchester earn $10,000 to $14,999.
10.8% of households in Winchester earn $15,000 to $24,999.
8.7% of households in Winchester earn $25,000 to $34,999.
11.4% of households in Winchester earn $35,000 to $49,999.
20.5% of households in Winchester earn $50,000 to $74,999.
12.7% of households in Winchester earn $75,000 to $99,999.
15.1% of households in Winchester earn $100,000 to $149,999.
5.7% of households in Winchester earn $150,000 to $199,999.
3.8% of households in Winchester earn $200,000 or more.
| Income | Winchester | KY | USA |
|---|---|---|---|
| Less than $10,000 | 4.0% | 6.0% | 4.9% |
| $10,000 to $14,999 | 7.2% | 5.4% | 3.6% |
| $15,000 to $24,999 | 10.8% | 8.5% | 6.6% |
| $25,000 to $34,999 | 8.7% | 8.6% | 6.8% |
| $35,000 to $49,999 | 11.4% | 12.5% | 10.4% |
| $50,000 to $74,999 | 20.5% | 17.1% | 15.7% |
| $75,000 to $99,999 | 12.7% | 12.9% | 12.7% |
| $100,000 to $149,999 | 15.1% | 15.8% | 17.4% |
| $150,000 to $199,999 | 5.7% | 6.7% | 9.3% |
| $200,000 or more | 3.8% | 6.7% | 12.6% |


