Bastrop, LA
Demographics And Statistics
Living In Bastrop, Louisiana Summary
Life in Bastrop research summary. HomeSnacks has been using Saturday Night Science to research the quality of life in Bastrop over the past nine years using Census, FBI, Zillow, and other primary data sources. Based on the most recently available data, we found the following about life in Bastrop:
The population in Bastrop is 9,408.
The median home value in Bastrop is $82,011.
The median income in Bastrop is $30,069.
The cost of living in Bastrop is 78 which is 0.8x lower than the national average.
The median rent in Bastrop is $828.
The unemployment rate in Bastrop is 13.8%.
The poverty rate in Bastrop is 42.4%.
The average high in Bastrop is 75.9° and the average low is 53.0°.
Bastrop SnackAbility
Overall SnackAbility
Bastrop, LA Crime Report
Crime in Bastrop summary. We use data from the FBI to determine the crime rates in Bastrop. Key points include:
There were 550 total crimes in Bastrop in the last reporting year.
The overall crime rate per 100,000 people in Bastrop is 6,255.7 / 100k people.
The violent crime rate per 100,000 people in Bastrop is 1,421.7 / 100k people.
The property crime rate per 100,000 people in Bastrop is 4,833.9 / 100k people.
Overall, crime in Bastrop is 195.19% above the national average.
Total Crimes
Above National Average
Crime In Bastrop Comparison Table
| Statistic | Count Raw |
Bastrop / 100k People |
Louisiana / 100k People |
National / 100k People |
|---|---|---|---|---|
| Total Crimes Per 100K | 550 | 6,255.7 | 2,816.2 | 2,119.2 |
| Violent Crime | 125 | 1,421.7 | 519.8 | 359.0 |
| Murder | 2 | 22.7 | 10.8 | 5.0 |
| Robbery | 3 | 34.1 | 39.4 | 61.0 |
| Aggravated Assault | 118 | 1,342.1 | 436.0 | 256.0 |
| Property Crime | 425 | 4,833.9 | 2,296.4 | 1,760.0 |
| Burglary | 118 | 1,342.1 | 405.4 | 229.0 |
| Larceny | 291 | 3,309.8 | 1,636.2 | 1,272.0 |
| Car Theft | 16 | 182.0 | 254.8 | 259.0 |
Bastrop, LA Cost Of Living
Cost of living in Bastrop summary. We use data on the cost of living to determine how expensive it is to live in Bastrop. Real estate prices drive most of the variance in cost of living around Louisiana. Key points include:
The cost of living in Bastrop is 78 with 100 being average.
The cost of living in Bastrop is 0.8x lower than the national average.
The median home value in Bastrop is $82,011.
The median income in Bastrop is $30,069.
Bastrop's Overall Cost Of Living
Lower Than The National Average
Cost Of Living In Bastrop Comparison Table
| Living Expense | Bastrop | Louisiana | National Average | |
|---|---|---|---|---|
| Overall | 78 | 90 | 100 | |
| Services | 90 | 94 | 100 | |
| Groceries | 96 | 93 | 100 | |
| Health | 104 | 100 | 100 | |
| Housing | 48 | 80 | 100 | |
| Transportation | 89 | 94 | 100 | |
| Utilities | 77 | 83 | 100 | |
Bastrop, LA Weather
The average high in Bastrop is 75.9° and the average low is 53.0°.
There are 71.4 days of precipitation each year.
Expect an average of 56.7 inches of precipitation each year with 0.7 inches of snow.
| Stat | Bastrop |
|---|---|
| Average Annual High | 75.9 |
| Average Annual Low | 53.0 |
| Annual Precipitation Days | 71.4 |
| Average Annual Precipitation | 56.7 |
| Average Annual Snowfall | 0.7 |
Average High
Days of Rain
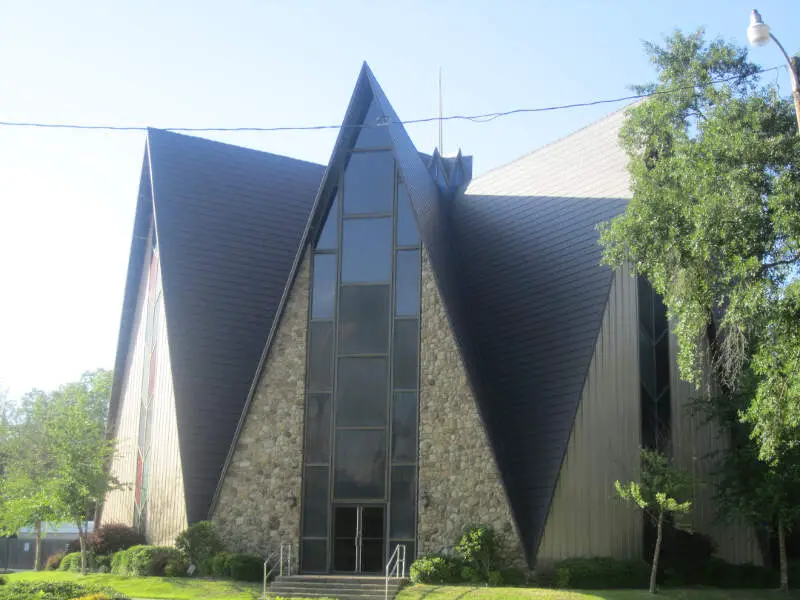
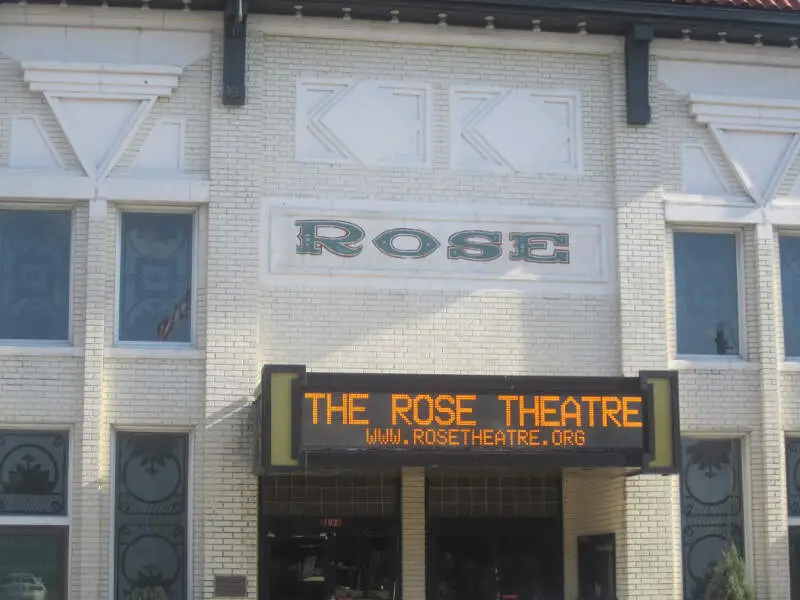
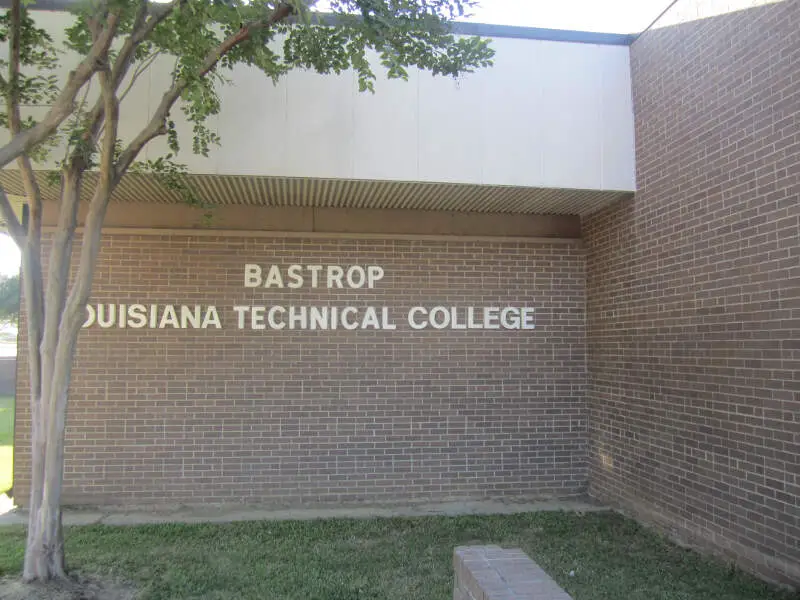
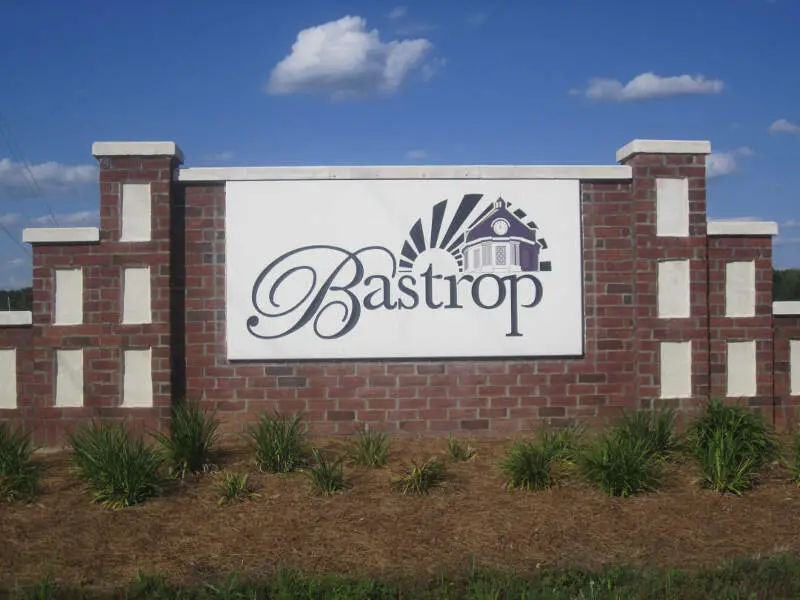
Bastrop, LA Photos


1 Reviews & Comments About Bastrop
/5

HomeSnacks User - None
I agree I live in Bastrop and I will admit that the town has gone down a little since the mill closed but I don't think it's nearly as bad as he is making it out to be
Rankings for Bastrop in Louisiana


Locations Around Bastrop
Map Of Bastrop, LA
Best Places Around Bastrop
Tallulah, LA
Population 6,124
Monroe, LA
Population 47,241
Ruston, LA
Population 22,224
West Monroe, LA
Population 12,837
Claiborne, LA
Population 12,647
Crossett, AR
Population 4,719
Bastrop Demographics And Statistics
Population over time in Bastrop
The current population in Bastrop is 9,408. The population has decreased -18.9% from 2010.
| Year | Population | % Change |
|---|---|---|
| 2023 | 9,408 | -2.2% |
| 2022 | 9,623 | -2.6% |
| 2021 | 9,879 | -1.8% |
| 2020 | 10,060 | -2.4% |
| 2019 | 10,311 | -2.0% |
| 2018 | 10,521 | -1.1% |
| 2017 | 10,643 | -1.9% |
| 2016 | 10,851 | -0.9% |
| 2015 | 10,949 | -1.1% |
| 2014 | 11,075 | -1.3% |
| 2013 | 11,216 | -1.2% |
| 2012 | 11,348 | -0.9% |
| 2011 | 11,452 | -1.3% |
| 2010 | 11,607 | - |
Race / Ethnicity in Bastrop
Bastrop is:
17.1% White with 1,608 White residents.
79.2% African American with 7,451 African American residents.
0.0% American Indian with 0 American Indian residents.
0.0% Asian with 0 Asian residents.
0.5% Hawaiian with 45 Hawaiian residents.
0.0% Other with 0 Other residents.
1.8% Two Or More with 165 Two Or More residents.
1.5% Hispanic with 139 Hispanic residents.
| Race | Bastrop | LA | USA |
|---|---|---|---|
| White | 17.1% | 56.2% | 58.2% |
| African American | 79.2% | 30.8% | 12.0% |
| American Indian | 0.0% | 0.4% | 0.5% |
| Asian | 0.0% | 1.7% | 5.7% |
| Hawaiian | 0.5% | 0.1% | 0.2% |
| Other | 0.0% | 0.5% | 0.5% |
| Two Or More | 1.8% | 3.3% | 3.9% |
| Hispanic | 1.5% | 6.9% | 19.0% |
Gender in Bastrop
Bastrop is 50.2% female with 4,721 female residents.
Bastrop is 49.8% male with 4,687 male residents.
| Gender | Bastrop | LA | USA |
|---|---|---|---|
| Female | 50.2% | 51.0% | 50.5% |
| Male | 49.8% | 49.0% | 49.5% |
Highest level of educational attainment in Bastrop for adults over 25
6.0% of adults in Bastrop completed < 9th grade.
13.0% of adults in Bastrop completed 9-12th grade.
34.0% of adults in Bastrop completed high school / ged.
28.0% of adults in Bastrop completed some college.
14.0% of adults in Bastrop completed associate's degree.
3.0% of adults in Bastrop completed bachelor's degree.
2.0% of adults in Bastrop completed master's degree.
0.0% of adults in Bastrop completed professional degree.
0.0% of adults in Bastrop completed doctorate degree.
| Education | Bastrop | LA | USA |
|---|---|---|---|
| < 9th Grade | 6.0% | 3.0% | 5.0% |
| 9-12th Grade | 13.0% | 9.0% | 6.0% |
| High School / GED | 34.0% | 33.0% | 26.0% |
| Some College | 28.0% | 21.0% | 19.0% |
| Associate's Degree | 14.0% | 7.0% | 9.0% |
| Bachelor's Degree | 3.0% | 17.0% | 21.0% |
| Master's Degree | 2.0% | 7.0% | 10.0% |
| Professional Degree | 0.0% | 2.0% | 2.0% |
| Doctorate Degree | 0.0% | 1.0% | 2.0% |
Household Income For Bastrop, Louisiana
12.7% of households in Bastrop earn Less than $10,000.
11.4% of households in Bastrop earn $10,000 to $14,999.
16.2% of households in Bastrop earn $15,000 to $24,999.
22.5% of households in Bastrop earn $25,000 to $34,999.
12.2% of households in Bastrop earn $35,000 to $49,999.
7.6% of households in Bastrop earn $50,000 to $74,999.
6.8% of households in Bastrop earn $75,000 to $99,999.
7.6% of households in Bastrop earn $100,000 to $149,999.
2.7% of households in Bastrop earn $150,000 to $199,999.
0.4% of households in Bastrop earn $200,000 or more.
| Income | Bastrop | LA | USA |
|---|---|---|---|
| Less than $10,000 | 12.7% | 7.3% | 4.9% |
| $10,000 to $14,999 | 11.4% | 5.9% | 3.6% |
| $15,000 to $24,999 | 16.2% | 9.6% | 6.6% |
| $25,000 to $34,999 | 22.5% | 8.6% | 6.8% |
| $35,000 to $49,999 | 12.2% | 11.8% | 10.4% |
| $50,000 to $74,999 | 7.6% | 15.9% | 15.7% |
| $75,000 to $99,999 | 6.8% | 11.6% | 12.7% |
| $100,000 to $149,999 | 7.6% | 14.8% | 17.4% |
| $150,000 to $199,999 | 2.7% | 7.3% | 9.3% |
| $200,000 or more | 0.4% | 7.4% | 12.6% |


