Dundalk, MD
Demographics And Statistics
Living In Dundalk, Maryland Summary
Life in Dundalk research summary. HomeSnacks has been using Saturday Night Science to research the quality of life in Dundalk over the past nine years using Census, FBI, Zillow, and other primary data sources. Based on the most recently available data, we found the following about life in Dundalk:
The population in Dundalk is 65,441.
The median home value in Dundalk is $221,084.
The median income in Dundalk is $62,349.
The cost of living in Dundalk is 103 which is 1.0x higher than the national average.
The median rent in Dundalk is $1,412.
The unemployment rate in Dundalk is 7.2%.
The poverty rate in Dundalk is 19.3%.
The average high in Dundalk is 64.9° and the average low is 48.4°.
Table Of Contents
Dundalk SnackAbility
Overall SnackAbility
Dundalk, MD Cost Of Living
Cost of living in Dundalk summary. We use data on the cost of living to determine how expensive it is to live in Dundalk. Real estate prices drive most of the variance in cost of living around Maryland. Key points include:
The cost of living in Dundalk is 103 with 100 being average.
The cost of living in Dundalk is 1.0x higher than the national average.
The median home value in Dundalk is $221,084.
The median income in Dundalk is $62,349.
Dundalk's Overall Cost Of Living
Higher Than The National Average
Cost Of Living In Dundalk Comparison Table
| Living Expense | Dundalk | Maryland | National Average | |
|---|---|---|---|---|
| Overall | 103 | 121 | 100 | |
| Services | 105 | 105 | 100 | |
| Groceries | 105 | 107 | 100 | |
| Health | 99 | 96 | 100 | |
| Housing | 96 | 150 | 100 | |
| Transportation | 100 | 99 | 100 | |
| Utilities | 112 | 113 | 100 | |
Dundalk, MD Weather
The average high in Dundalk is 64.9° and the average low is 48.4°.
There are 68.4 days of precipitation each year.
Expect an average of 44.3 inches of precipitation each year with 16.6 inches of snow.
| Stat | Dundalk |
|---|---|
| Average Annual High | 64.9 |
| Average Annual Low | 48.4 |
| Annual Precipitation Days | 68.4 |
| Average Annual Precipitation | 44.3 |
| Average Annual Snowfall | 16.6 |
Average High
Days of Rain
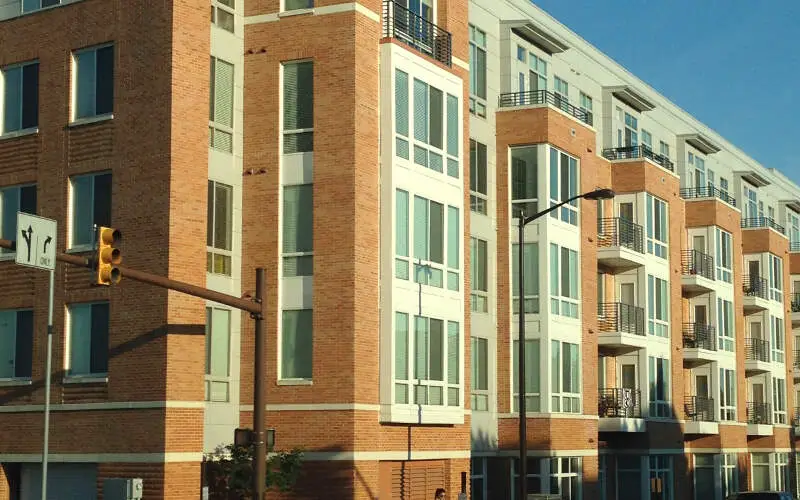
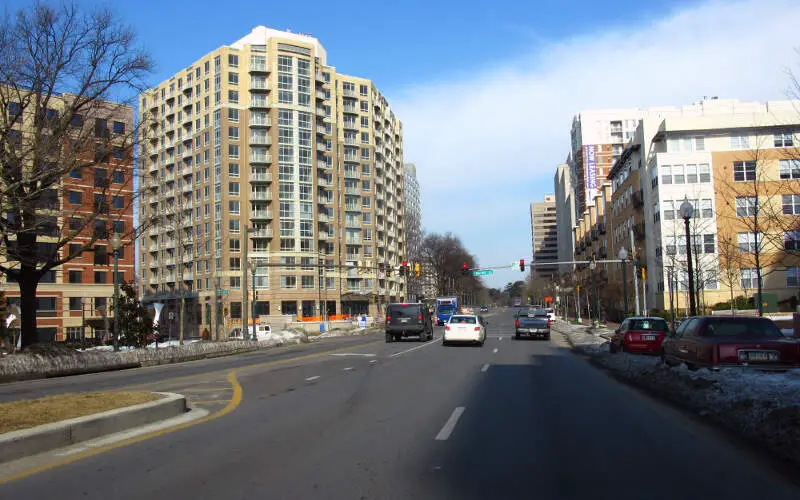
Dundalk, MD Photos

1 Reviews & Comments About Dundalk
/5

Nathan Bales - None
I live in Dundalk there is no crime drugs maybe junkies but Dundalk is probably the best place to live in all of Maryland
Rankings for Dundalk in Maryland


Locations Around Dundalk
Map Of Dundalk, MD
Best Places Around Dundalk
Ilchester, MD
Population 27,552
Columbia, MD
Population 105,871
Savage, MD
Population 8,284
Severna Park, MD
Population 39,499
Cape St. Claire, MD
Population 9,016
Elkridge, MD
Population 26,183
Fallston, MD
Population 9,954
Bel Air South, MD
Population 57,702
Arnold, MD
Population 23,866
Riviera Beach, MD
Population 12,608
Dundalk Demographics And Statistics
Population over time in Dundalk
The current population in Dundalk is 65,441. The population has increased 4.8% from 2010.
| Year | Population | % Change |
|---|---|---|
| 2023 | 65,441 | -1.3% |
| 2022 | 66,321 | -0.2% |
| 2021 | 66,426 | 4.1% |
| 2020 | 63,826 | 1.3% |
| 2019 | 63,015 | 0.4% |
| 2018 | 62,768 | 0.4% |
| 2017 | 62,516 | 0.3% |
| 2016 | 62,337 | -0.0% |
| 2015 | 62,349 | 0.3% |
| 2014 | 62,186 | 0.4% |
| 2013 | 61,930 | -0.8% |
| 2012 | 62,459 | 1.0% |
| 2011 | 61,852 | -0.9% |
| 2010 | 62,444 | - |
Race / Ethnicity in Dundalk
Dundalk is:
61.0% White with 39,909 White residents.
17.3% African American with 11,354 African American residents.
0.4% American Indian with 248 American Indian residents.
2.3% Asian with 1,478 Asian residents.
0.0% Hawaiian with 0 Hawaiian residents.
0.6% Other with 411 Other residents.
4.7% Two Or More with 3,108 Two Or More residents.
13.7% Hispanic with 8,933 Hispanic residents.
| Race | Dundalk | MD | USA |
|---|---|---|---|
| White | 61.0% | 47.4% | 58.2% |
| African American | 17.3% | 29.2% | 12.0% |
| American Indian | 0.4% | 0.1% | 0.5% |
| Asian | 2.3% | 6.4% | 5.7% |
| Hawaiian | 0.0% | 0.0% | 0.2% |
| Other | 0.6% | 0.6% | 0.5% |
| Two Or More | 4.7% | 4.2% | 3.9% |
| Hispanic | 13.7% | 12.1% | 19.0% |
Gender in Dundalk
Dundalk is 51.6% female with 33,788 female residents.
Dundalk is 48.4% male with 31,653 male residents.
| Gender | Dundalk | MD | USA |
|---|---|---|---|
| Female | 51.6% | 51.3% | 50.5% |
| Male | 48.4% | 48.7% | 49.5% |
Highest level of educational attainment in Dundalk for adults over 25
5.0% of adults in Dundalk completed < 9th grade.
10.0% of adults in Dundalk completed 9-12th grade.
41.0% of adults in Dundalk completed high school / ged.
21.0% of adults in Dundalk completed some college.
8.0% of adults in Dundalk completed associate's degree.
10.0% of adults in Dundalk completed bachelor's degree.
3.0% of adults in Dundalk completed master's degree.
1.0% of adults in Dundalk completed professional degree.
1.0% of adults in Dundalk completed doctorate degree.
| Education | Dundalk | MD | USA |
|---|---|---|---|
| < 9th Grade | 5.0% | 4.0% | 5.0% |
| 9-12th Grade | 10.0% | 5.0% | 6.0% |
| High School / GED | 41.0% | 24.0% | 26.0% |
| Some College | 21.0% | 18.0% | 19.0% |
| Associate's Degree | 8.0% | 7.0% | 9.0% |
| Bachelor's Degree | 10.0% | 22.0% | 21.0% |
| Master's Degree | 3.0% | 14.0% | 10.0% |
| Professional Degree | 1.0% | 3.0% | 2.0% |
| Doctorate Degree | 1.0% | 3.0% | 2.0% |
Household Income For Dundalk, Maryland
6.5% of households in Dundalk earn Less than $10,000.
4.5% of households in Dundalk earn $10,000 to $14,999.
9.2% of households in Dundalk earn $15,000 to $24,999.
9.1% of households in Dundalk earn $25,000 to $34,999.
11.7% of households in Dundalk earn $35,000 to $49,999.
17.2% of households in Dundalk earn $50,000 to $74,999.
14.4% of households in Dundalk earn $75,000 to $99,999.
15.5% of households in Dundalk earn $100,000 to $149,999.
7.3% of households in Dundalk earn $150,000 to $199,999.
4.6% of households in Dundalk earn $200,000 or more.
| Income | Dundalk | MD | USA |
|---|---|---|---|
| Less than $10,000 | 6.5% | 4.3% | 4.9% |
| $10,000 to $14,999 | 4.5% | 2.5% | 3.6% |
| $15,000 to $24,999 | 9.2% | 4.5% | 6.6% |
| $25,000 to $34,999 | 9.1% | 4.9% | 6.8% |
| $35,000 to $49,999 | 11.7% | 7.9% | 10.4% |
| $50,000 to $74,999 | 17.2% | 13.2% | 15.7% |
| $75,000 to $99,999 | 14.4% | 12.0% | 12.7% |
| $100,000 to $149,999 | 15.5% | 19.3% | 17.4% |
| $150,000 to $199,999 | 7.3% | 12.4% | 9.3% |
| $200,000 or more | 4.6% | 19.2% | 12.6% |


