Greenbelt, MD
Demographics And Statistics
Living In Greenbelt, Maryland Summary
Life in Greenbelt research summary. HomeSnacks has been using Saturday Night Science to research the quality of life in Greenbelt over the past nine years using Census, FBI, Zillow, and other primary data sources. Based on the most recently available data, we found the following about life in Greenbelt:
The population in Greenbelt is 24,572.
The median home value in Greenbelt is $290,394.
The median income in Greenbelt is $86,352.
The cost of living in Greenbelt is 120 which is 1.2x higher than the national average.
The median rent in Greenbelt is $1,807.
The unemployment rate in Greenbelt is 7.4%.
The poverty rate in Greenbelt is 18.5%.
The average high in Greenbelt is 65.8° and the average low is 45.0°.
Greenbelt SnackAbility
Overall SnackAbility
Greenbelt, MD Crime Report
Crime in Greenbelt summary. We use data from the FBI to determine the crime rates in Greenbelt. Key points include:
There were 1,216 total crimes in Greenbelt in the last reporting year.
The overall crime rate per 100,000 people in Greenbelt is 5,026.2 / 100k people.
The violent crime rate per 100,000 people in Greenbelt is 648.9 / 100k people.
The property crime rate per 100,000 people in Greenbelt is 4,377.3 / 100k people.
Overall, crime in Greenbelt is 137.17% above the national average.
Total Crimes
Above National Average
Crime In Greenbelt Comparison Table
| Statistic | Count Raw |
Greenbelt / 100k People |
Maryland / 100k People |
National / 100k People |
|---|---|---|---|---|
| Total Crimes Per 100K | 1,216 | 5,026.2 | 2,470.0 | 2,119.2 |
| Violent Crime | 157 | 648.9 | 420.4 | 359.0 |
| Murder | 0 | 0.0 | 7.2 | 5.0 |
| Robbery | 79 | 326.5 | 123.2 | 61.0 |
| Aggravated Assault | 68 | 281.1 | 257.0 | 256.0 |
| Property Crime | 1,059 | 4,377.3 | 2,049.6 | 1,760.0 |
| Burglary | 36 | 148.8 | 190.0 | 229.0 |
| Larceny | 767 | 3,170.3 | 1,446.8 | 1,272.0 |
| Car Theft | 256 | 1,058.2 | 412.8 | 259.0 |
Greenbelt, MD Cost Of Living
Cost of living in Greenbelt summary. We use data on the cost of living to determine how expensive it is to live in Greenbelt. Real estate prices drive most of the variance in cost of living around Maryland. Key points include:
The cost of living in Greenbelt is 120 with 100 being average.
The cost of living in Greenbelt is 1.2x higher than the national average.
The median home value in Greenbelt is $290,394.
The median income in Greenbelt is $86,352.
Greenbelt's Overall Cost Of Living
Higher Than The National Average
Cost Of Living In Greenbelt Comparison Table
| Living Expense | Greenbelt | Maryland | National Average | |
|---|---|---|---|---|
| Overall | 120 | 121 | 100 | |
| Services | 118 | 105 | 100 | |
| Groceries | 105 | 107 | 100 | |
| Health | 108 | 96 | 100 | |
| Housing | 137 | 150 | 100 | |
| Transportation | 105 | 99 | 100 | |
| Utilities | 112 | 113 | 100 | |
Greenbelt, MD Weather
The average high in Greenbelt is 65.8° and the average low is 45.0°.
There are 74.7 days of precipitation each year.
Expect an average of 42.8 inches of precipitation each year with 13.5 inches of snow.
| Stat | Greenbelt |
|---|---|
| Average Annual High | 65.8 |
| Average Annual Low | 45.0 |
| Annual Precipitation Days | 74.7 |
| Average Annual Precipitation | 42.8 |
| Average Annual Snowfall | 13.5 |
Average High
Days of Rain
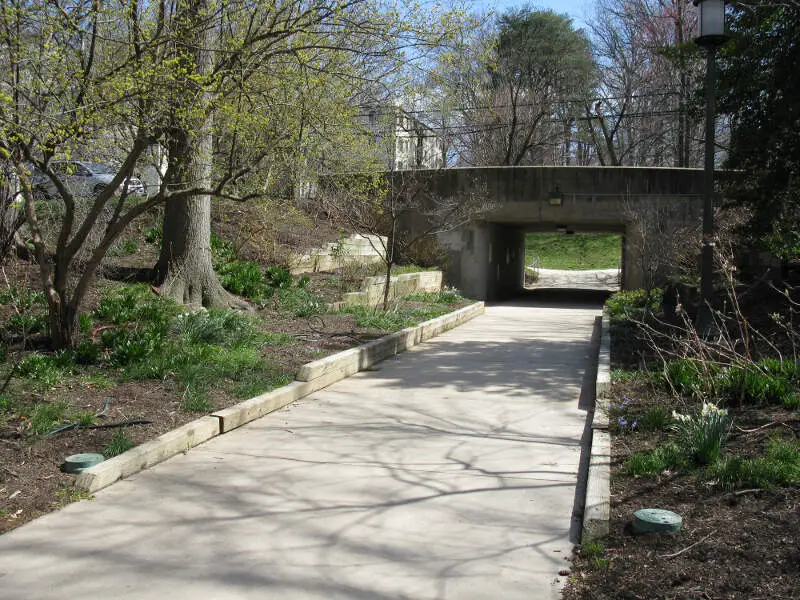
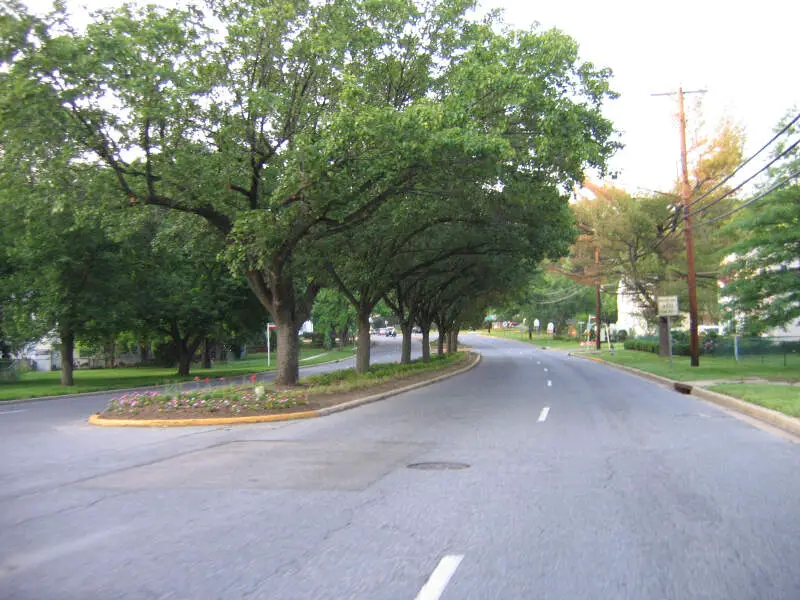
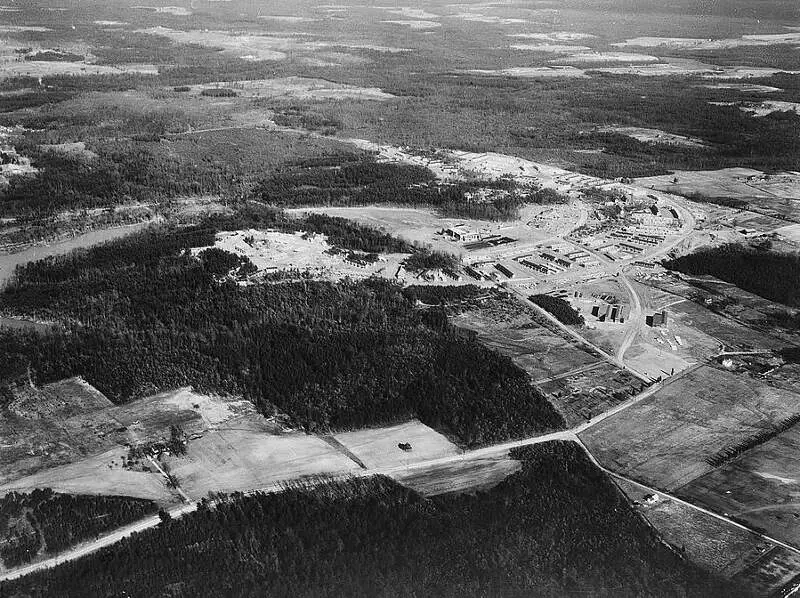
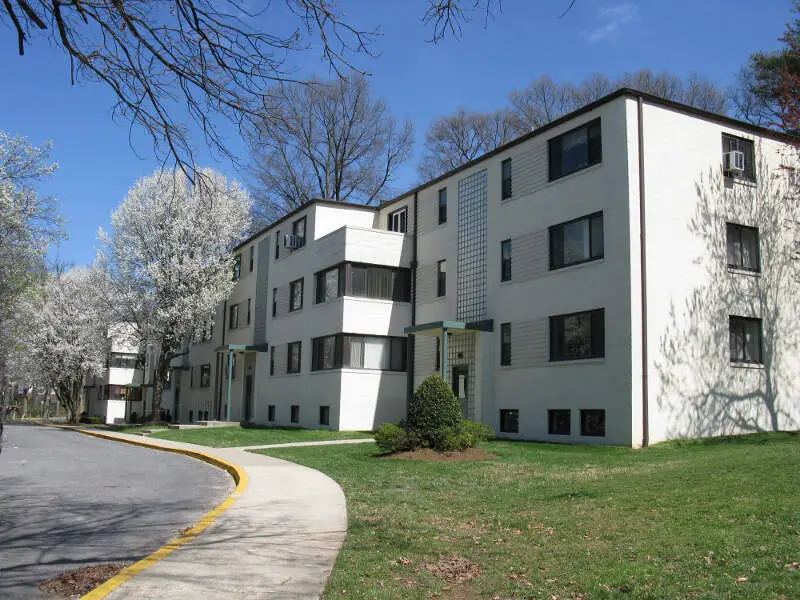
Greenbelt, MD Photos


Rankings for Greenbelt in Maryland


Locations Around Greenbelt
Map Of Greenbelt, MD
Best Places Around Greenbelt
Four Corners, MD
Population 7,785
Layhill, MD
Population 5,392
South Kensington, MD
Population 8,057
Ilchester, MD
Population 27,552
North Laurel, MD
Population 25,201
Colesville, MD
Population 14,075
Olney, MD
Population 36,000
Kemp Mill, MD
Population 14,437
Chevy Chase, MD
Population 9,484
Greenbelt Demographics And Statistics
Population over time in Greenbelt
The current population in Greenbelt is 24,572. The population has increased 7.7% from 2010.
| Year | Population | % Change |
|---|---|---|
| 2023 | 24,572 | -0.3% |
| 2022 | 24,646 | 0.2% |
| 2021 | 24,602 | 5.8% |
| 2020 | 23,253 | 0.1% |
| 2019 | 23,219 | 0.1% |
| 2018 | 23,203 | -0.4% |
| 2017 | 23,289 | -1.4% |
| 2016 | 23,623 | -0.9% |
| 2015 | 23,827 | 0.9% |
| 2014 | 23,612 | 1.3% |
| 2013 | 23,310 | 0.9% |
| 2012 | 23,113 | 0.8% |
| 2011 | 22,922 | 0.5% |
| 2010 | 22,817 | - |
Race / Ethnicity in Greenbelt
Greenbelt is:
20.7% White with 5,084 White residents.
45.4% African American with 11,165 African American residents.
0.3% American Indian with 70 American Indian residents.
9.0% Asian with 2,208 Asian residents.
0.0% Hawaiian with 0 Hawaiian residents.
1.0% Other with 252 Other residents.
6.5% Two Or More with 1,601 Two Or More residents.
17.1% Hispanic with 4,192 Hispanic residents.
| Race | Greenbelt | MD | USA |
|---|---|---|---|
| White | 20.7% | 47.4% | 58.2% |
| African American | 45.4% | 29.2% | 12.0% |
| American Indian | 0.3% | 0.1% | 0.5% |
| Asian | 9.0% | 6.4% | 5.7% |
| Hawaiian | 0.0% | 0.0% | 0.2% |
| Other | 1.0% | 0.6% | 0.5% |
| Two Or More | 6.5% | 4.2% | 3.9% |
| Hispanic | 17.1% | 12.1% | 19.0% |
Gender in Greenbelt
Greenbelt is 55.5% female with 13,627 female residents.
Greenbelt is 44.5% male with 10,945 male residents.
| Gender | Greenbelt | MD | USA |
|---|---|---|---|
| Female | 55.5% | 51.3% | 50.5% |
| Male | 44.5% | 48.7% | 49.5% |
Highest level of educational attainment in Greenbelt for adults over 25
6.0% of adults in Greenbelt completed < 9th grade.
4.0% of adults in Greenbelt completed 9-12th grade.
19.0% of adults in Greenbelt completed high school / ged.
16.0% of adults in Greenbelt completed some college.
9.0% of adults in Greenbelt completed associate's degree.
25.0% of adults in Greenbelt completed bachelor's degree.
15.0% of adults in Greenbelt completed master's degree.
2.0% of adults in Greenbelt completed professional degree.
4.0% of adults in Greenbelt completed doctorate degree.
| Education | Greenbelt | MD | USA |
|---|---|---|---|
| < 9th Grade | 6.0% | 4.0% | 5.0% |
| 9-12th Grade | 4.0% | 5.0% | 6.0% |
| High School / GED | 19.0% | 24.0% | 26.0% |
| Some College | 16.0% | 18.0% | 19.0% |
| Associate's Degree | 9.0% | 7.0% | 9.0% |
| Bachelor's Degree | 25.0% | 22.0% | 21.0% |
| Master's Degree | 15.0% | 14.0% | 10.0% |
| Professional Degree | 2.0% | 3.0% | 2.0% |
| Doctorate Degree | 4.0% | 3.0% | 2.0% |
Household Income For Greenbelt, Maryland
6.8% of households in Greenbelt earn Less than $10,000.
5.7% of households in Greenbelt earn $10,000 to $14,999.
6.1% of households in Greenbelt earn $15,000 to $24,999.
5.0% of households in Greenbelt earn $25,000 to $34,999.
7.1% of households in Greenbelt earn $35,000 to $49,999.
14.4% of households in Greenbelt earn $50,000 to $74,999.
10.9% of households in Greenbelt earn $75,000 to $99,999.
23.7% of households in Greenbelt earn $100,000 to $149,999.
8.3% of households in Greenbelt earn $150,000 to $199,999.
11.8% of households in Greenbelt earn $200,000 or more.
| Income | Greenbelt | MD | USA |
|---|---|---|---|
| Less than $10,000 | 6.8% | 4.3% | 4.9% |
| $10,000 to $14,999 | 5.7% | 2.5% | 3.6% |
| $15,000 to $24,999 | 6.1% | 4.5% | 6.6% |
| $25,000 to $34,999 | 5.0% | 4.9% | 6.8% |
| $35,000 to $49,999 | 7.1% | 7.9% | 10.4% |
| $50,000 to $74,999 | 14.4% | 13.2% | 15.7% |
| $75,000 to $99,999 | 10.9% | 12.0% | 12.7% |
| $100,000 to $149,999 | 23.7% | 19.3% | 17.4% |
| $150,000 to $199,999 | 8.3% | 12.4% | 9.3% |
| $200,000 or more | 11.8% | 19.2% | 12.6% |


