Fenton, MI
Demographics And Statistics
Living In Fenton, Michigan Summary
Life in Fenton research summary. HomeSnacks has been using Saturday Night Science to research the quality of life in Fenton over the past nine years using Census, FBI, Zillow, and other primary data sources. Based on the most recently available data, we found the following about life in Fenton:
The population in Fenton is 11,950.
The median home value in Fenton is $355,121.
The median income in Fenton is $83,077.
The cost of living in Fenton is 96 which is 1.0x lower than the national average.
The median rent in Fenton is $1,323.
The unemployment rate in Fenton is 8.4%.
The poverty rate in Fenton is 6.3%.
The average high in Fenton is 56.7° and the average low is 38.2°.
Fenton SnackAbility
Overall SnackAbility
Fenton, MI Crime Report
Crime in Fenton summary. We use data from the FBI to determine the crime rates in Fenton. Key points include:
There were 303 total crimes in Fenton in the last reporting year.
The overall crime rate per 100,000 people in Fenton is 2,566.1 / 100k people.
The violent crime rate per 100,000 people in Fenton is 169.4 / 100k people.
The property crime rate per 100,000 people in Fenton is 2,396.7 / 100k people.
Overall, crime in Fenton is 21.08% above the national average.
Total Crimes
Above National Average
Crime In Fenton Comparison Table
| Statistic | Count Raw |
Fenton / 100k People |
Michigan / 100k People |
National / 100k People |
|---|---|---|---|---|
| Total Crimes Per 100K | 303 | 2,566.1 | 1,813.2 | 2,119.2 |
| Violent Crime | 20 | 169.4 | 434.3 | 359.0 |
| Murder | 0 | 0.0 | 5.2 | 5.0 |
| Robbery | 2 | 16.9 | 31.3 | 61.0 |
| Aggravated Assault | 15 | 127.0 | 341.3 | 256.0 |
| Property Crime | 283 | 2,396.7 | 1,378.9 | 1,760.0 |
| Burglary | 7 | 59.3 | 184.2 | 229.0 |
| Larceny | 266 | 2,252.7 | 963.6 | 1,272.0 |
| Car Theft | 10 | 84.7 | 231.0 | 259.0 |
Fenton, MI Cost Of Living
Cost of living in Fenton summary. We use data on the cost of living to determine how expensive it is to live in Fenton. Real estate prices drive most of the variance in cost of living around Michigan. Key points include:
The cost of living in Fenton is 96 with 100 being average.
The cost of living in Fenton is 1.0x lower than the national average.
The median home value in Fenton is $355,121.
The median income in Fenton is $83,077.
Fenton's Overall Cost Of Living
Lower Than The National Average
Cost Of Living In Fenton Comparison Table
| Living Expense | Fenton | Michigan | National Average | |
|---|---|---|---|---|
| Overall | 96 | 90 | 100 | |
| Services | 104 | 93 | 100 | |
| Groceries | 104 | 97 | 100 | |
| Health | 100 | 91 | 100 | |
| Housing | 92 | 72 | 100 | |
| Transportation | 102 | 96 | 100 | |
| Utilities | 92 | 99 | 100 | |
Fenton, MI Weather
The average high in Fenton is 56.7° and the average low is 38.2°.
There are 69.2 days of precipitation each year.
Expect an average of 32.5 inches of precipitation each year with 37.3 inches of snow.
| Stat | Fenton |
|---|---|
| Average Annual High | 56.7 |
| Average Annual Low | 38.2 |
| Annual Precipitation Days | 69.2 |
| Average Annual Precipitation | 32.5 |
| Average Annual Snowfall | 37.3 |
Average High
Days of Rain
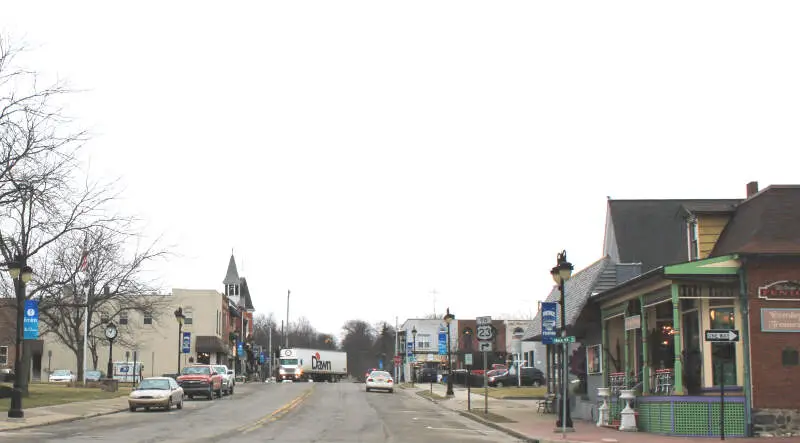
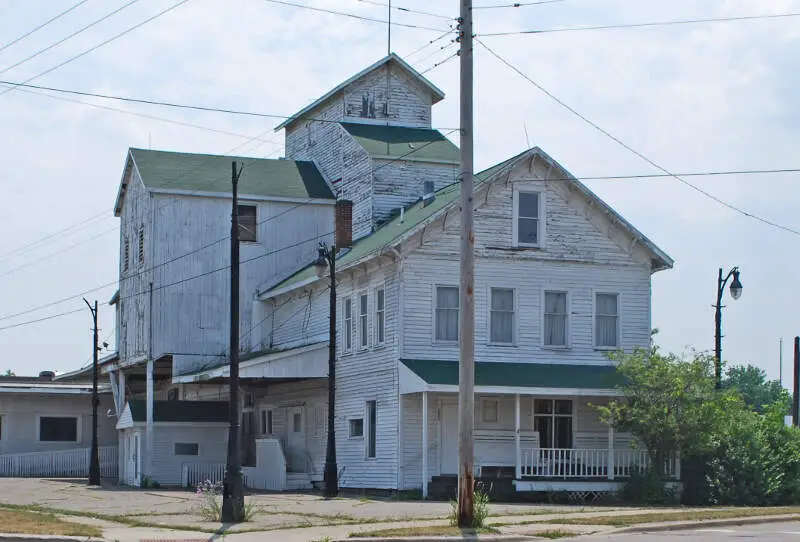
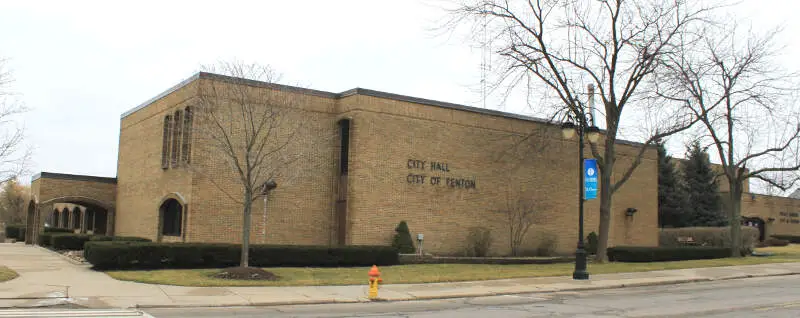
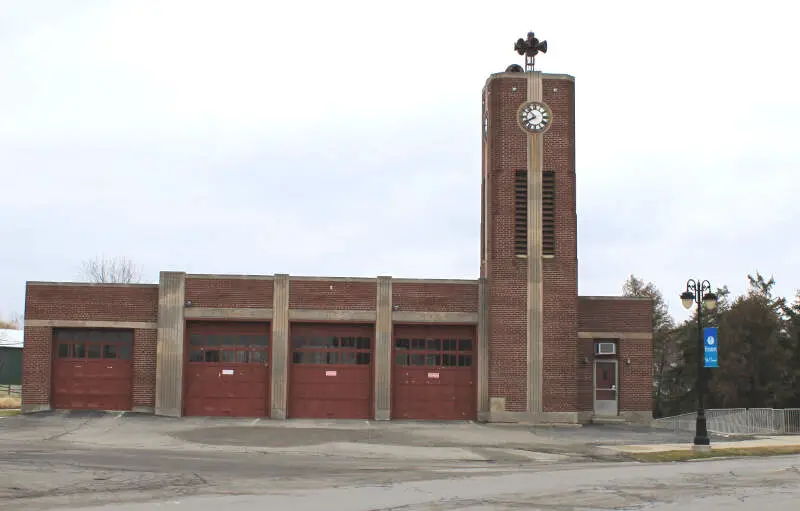
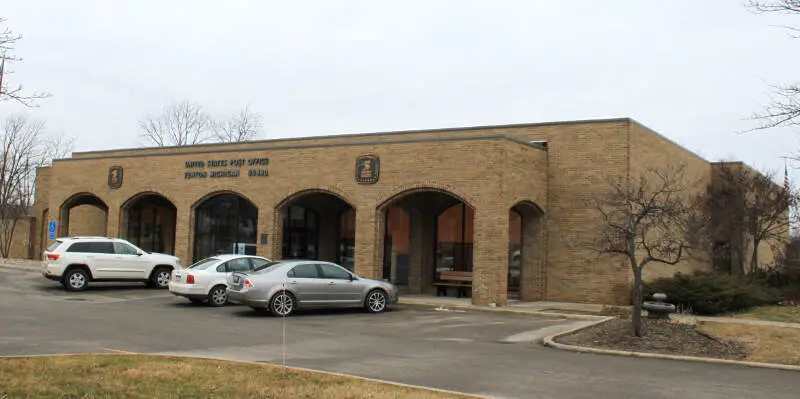
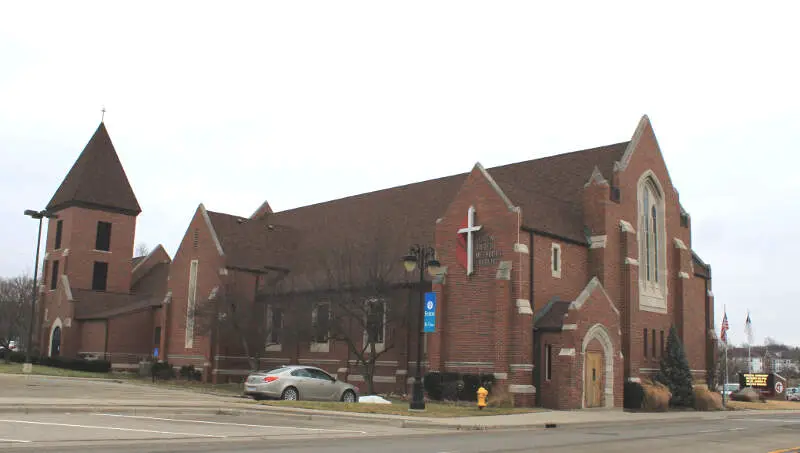
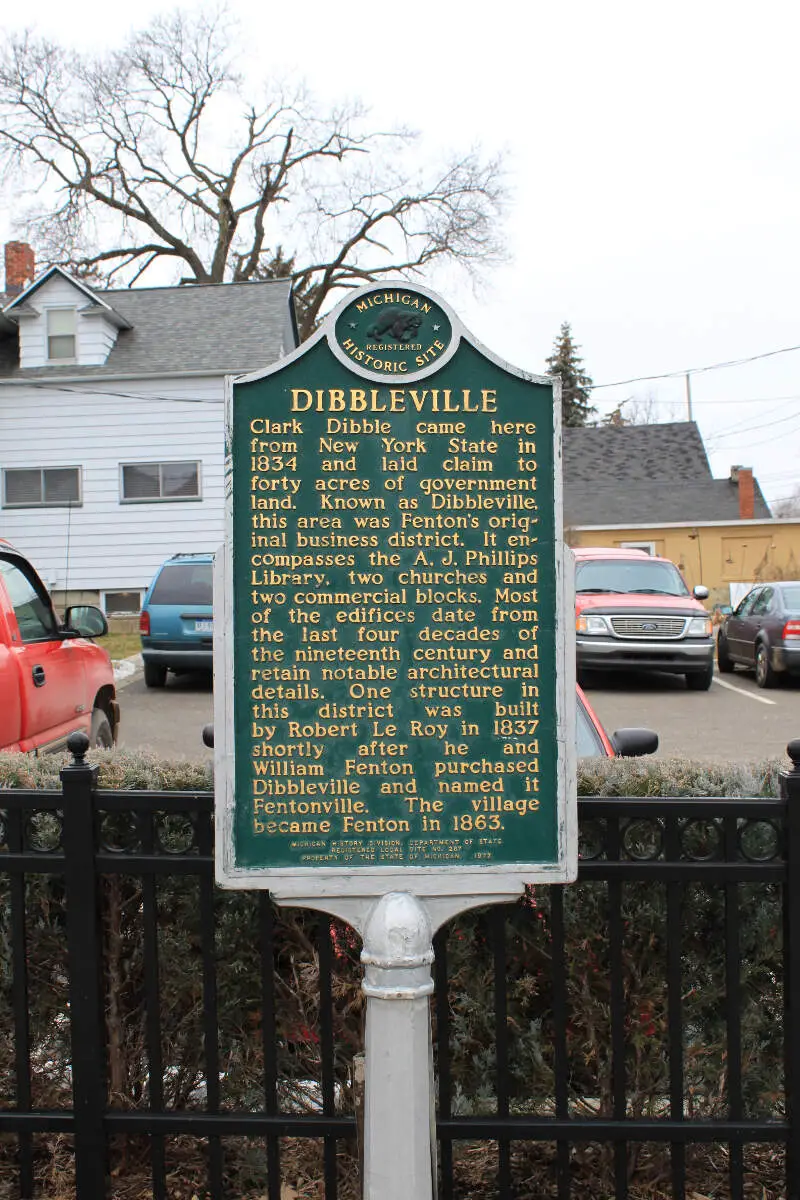
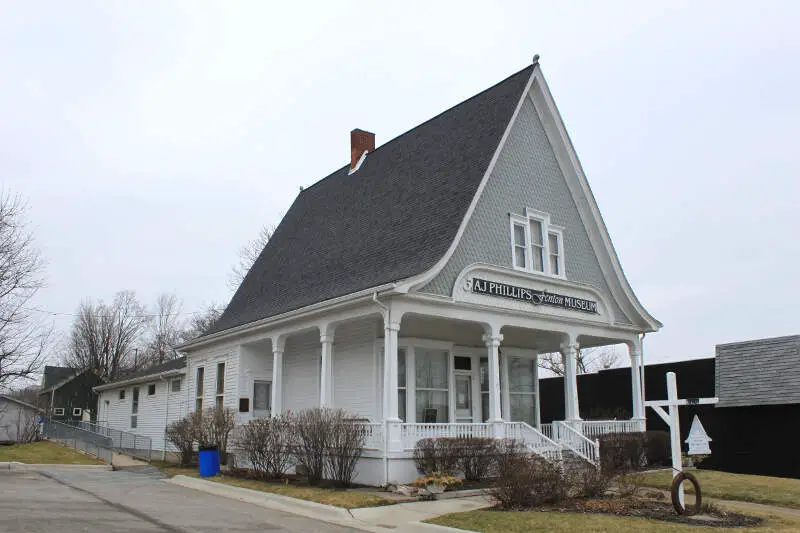
Fenton, MI Photos
Rankings for Fenton in Michigan


Locations Around Fenton
Map Of Fenton, MI
Best Places Around Fenton
Milford, MI
Population 6,467
Grand Blanc, MI
Population 7,995
Holly, MI
Population 5,971
Lake Fenton, MI
Population 6,168
Flushing, MI
Population 8,323
Brighton, MI
Population 7,576
Howell, MI
Population 10,074
Burton, MI
Population 29,529
Swartz Creek, MI
Population 5,856
Davison, MI
Population 5,082
Fenton Demographics And Statistics
Population over time in Fenton
The current population in Fenton is 11,950. The population has increased 2.4% from 2010.
| Year | Population | % Change |
|---|---|---|
| 2023 | 11,950 | -0.1% |
| 2022 | 11,967 | 0.2% |
| 2021 | 11,949 | 5.1% |
| 2020 | 11,368 | -0.1% |
| 2019 | 11,375 | 0.3% |
| 2018 | 11,336 | -0.2% |
| 2017 | 11,364 | -0.9% |
| 2016 | 11,471 | -0.6% |
| 2015 | 11,538 | -0.5% |
| 2014 | 11,601 | -0.5% |
| 2013 | 11,656 | 0.0% |
| 2012 | 11,656 | -0.2% |
| 2011 | 11,681 | 0.1% |
| 2010 | 11,675 | - |
Race / Ethnicity in Fenton
Fenton is:
88.5% White with 10,580 White residents.
2.2% African American with 265 African American residents.
0.0% American Indian with 0 American Indian residents.
2.8% Asian with 335 Asian residents.
0.0% Hawaiian with 0 Hawaiian residents.
0.2% Other with 24 Other residents.
3.7% Two Or More with 443 Two Or More residents.
2.5% Hispanic with 303 Hispanic residents.
| Race | Fenton | MI | USA |
|---|---|---|---|
| White | 88.5% | 73.0% | 58.2% |
| African American | 2.2% | 13.2% | 12.0% |
| American Indian | 0.0% | 0.3% | 0.5% |
| Asian | 2.8% | 3.3% | 5.7% |
| Hawaiian | 0.0% | 0.0% | 0.2% |
| Other | 0.2% | 0.4% | 0.5% |
| Two Or More | 3.7% | 4.1% | 3.9% |
| Hispanic | 2.5% | 5.7% | 19.0% |
Gender in Fenton
Fenton is 55.5% female with 6,635 female residents.
Fenton is 44.5% male with 5,315 male residents.
| Gender | Fenton | MI | USA |
|---|---|---|---|
| Female | 55.5% | 50.4% | 50.5% |
| Male | 44.5% | 49.6% | 49.5% |
Highest level of educational attainment in Fenton for adults over 25
2.0% of adults in Fenton completed < 9th grade.
1.0% of adults in Fenton completed 9-12th grade.
24.0% of adults in Fenton completed high school / ged.
27.0% of adults in Fenton completed some college.
11.0% of adults in Fenton completed associate's degree.
21.0% of adults in Fenton completed bachelor's degree.
11.0% of adults in Fenton completed master's degree.
2.0% of adults in Fenton completed professional degree.
1.0% of adults in Fenton completed doctorate degree.
| Education | Fenton | MI | USA |
|---|---|---|---|
| < 9th Grade | 2.0% | 3.0% | 5.0% |
| 9-12th Grade | 1.0% | 6.0% | 6.0% |
| High School / GED | 24.0% | 28.0% | 26.0% |
| Some College | 27.0% | 22.0% | 19.0% |
| Associate's Degree | 11.0% | 10.0% | 9.0% |
| Bachelor's Degree | 21.0% | 19.0% | 21.0% |
| Master's Degree | 11.0% | 9.0% | 10.0% |
| Professional Degree | 2.0% | 2.0% | 2.0% |
| Doctorate Degree | 1.0% | 1.0% | 2.0% |
Household Income For Fenton, Michigan
3.3% of households in Fenton earn Less than $10,000.
1.3% of households in Fenton earn $10,000 to $14,999.
8.7% of households in Fenton earn $15,000 to $24,999.
4.2% of households in Fenton earn $25,000 to $34,999.
8.3% of households in Fenton earn $35,000 to $49,999.
18.9% of households in Fenton earn $50,000 to $74,999.
13.3% of households in Fenton earn $75,000 to $99,999.
16.9% of households in Fenton earn $100,000 to $149,999.
14.4% of households in Fenton earn $150,000 to $199,999.
10.8% of households in Fenton earn $200,000 or more.
| Income | Fenton | MI | USA |
|---|---|---|---|
| Less than $10,000 | 3.3% | 5.0% | 4.9% |
| $10,000 to $14,999 | 1.3% | 3.9% | 3.6% |
| $15,000 to $24,999 | 8.7% | 7.1% | 6.6% |
| $25,000 to $34,999 | 4.2% | 7.6% | 6.8% |
| $35,000 to $49,999 | 8.3% | 11.8% | 10.4% |
| $50,000 to $74,999 | 18.9% | 16.9% | 15.7% |
| $75,000 to $99,999 | 13.3% | 13.4% | 12.7% |
| $100,000 to $149,999 | 16.9% | 16.9% | 17.4% |
| $150,000 to $199,999 | 14.4% | 8.3% | 9.3% |
| $200,000 or more | 10.8% | 9.0% | 12.6% |


