Howell, MI
Demographics And Statistics
Living In Howell, Michigan Summary
Life in Howell research summary. HomeSnacks has been using Saturday Night Science to research the quality of life in Howell over the past nine years using Census, FBI, Zillow, and other primary data sources. Based on the most recently available data, we found the following about life in Howell:
The population in Howell is 10,074.
The median home value in Howell is $373,744.
The median income in Howell is $57,122.
The cost of living in Howell is 98 which is 1.0x lower than the national average.
The median rent in Howell is $1,121.
The unemployment rate in Howell is 3.2%.
The poverty rate in Howell is 7.1%.
The average high in Howell is 57.6° and the average low is 38.1°.
Howell SnackAbility
Overall SnackAbility
Howell, MI Crime Report
Crime in Howell summary. We use data from the FBI to determine the crime rates in Howell. Key points include:
There were 75 total crimes in Howell in the last reporting year.
The overall crime rate per 100,000 people in Howell is 751.1 / 100k people.
The violent crime rate per 100,000 people in Howell is 110.2 / 100k people.
The property crime rate per 100,000 people in Howell is 641.0 / 100k people.
Overall, crime in Howell is -64.56% below the national average.
Total Crimes
Below National Average
Crime In Howell Comparison Table
| Statistic | Count Raw |
Howell / 100k People |
Michigan / 100k People |
National / 100k People |
|---|---|---|---|---|
| Total Crimes Per 100K | 75 | 751.1 | 1,813.2 | 2,119.2 |
| Violent Crime | 11 | 110.2 | 434.3 | 359.0 |
| Murder | 1 | 10.0 | 5.2 | 5.0 |
| Robbery | 0 | 0.0 | 31.3 | 61.0 |
| Aggravated Assault | 7 | 70.1 | 341.3 | 256.0 |
| Property Crime | 64 | 641.0 | 1,378.9 | 1,760.0 |
| Burglary | 4 | 40.1 | 184.2 | 229.0 |
| Larceny | 51 | 510.8 | 963.6 | 1,272.0 |
| Car Theft | 9 | 90.1 | 231.0 | 259.0 |
Howell, MI Cost Of Living
Cost of living in Howell summary. We use data on the cost of living to determine how expensive it is to live in Howell. Real estate prices drive most of the variance in cost of living around Michigan. Key points include:
The cost of living in Howell is 98 with 100 being average.
The cost of living in Howell is 1.0x lower than the national average.
The median home value in Howell is $373,744.
The median income in Howell is $57,122.
Howell's Overall Cost Of Living
Lower Than The National Average
Cost Of Living In Howell Comparison Table
| Living Expense | Howell | Michigan | National Average | |
|---|---|---|---|---|
| Overall | 98 | 90 | 100 | |
| Services | 102 | 93 | 100 | |
| Groceries | 104 | 97 | 100 | |
| Health | 104 | 91 | 100 | |
| Housing | 96 | 72 | 100 | |
| Transportation | 99 | 96 | 100 | |
| Utilities | 94 | 99 | 100 | |
Howell, MI Weather
The average high in Howell is 57.6° and the average low is 38.1°.
There are 71.0 days of precipitation each year.
Expect an average of 32.7 inches of precipitation each year with 38.4 inches of snow.
| Stat | Howell |
|---|---|
| Average Annual High | 57.6 |
| Average Annual Low | 38.1 |
| Annual Precipitation Days | 71.0 |
| Average Annual Precipitation | 32.7 |
| Average Annual Snowfall | 38.4 |
Average High
Days of Rain
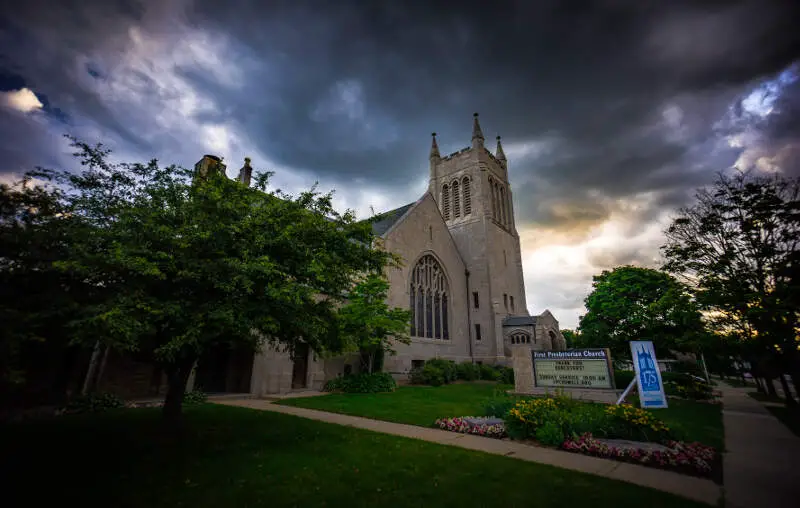
Howell, MI Photos


Rankings for Howell in Michigan


Locations Around Howell
Map Of Howell, MI
Best Places Around Howell
South Lyon, MI
Population 11,825
Milford, MI
Population 6,467
Whitmore Lake, MI
Population 8,083
Lake Fenton, MI
Population 6,168
Brighton, MI
Population 7,576
Fenton, MI
Population 11,950
Howell Demographics And Statistics
Population over time in Howell
The current population in Howell is 10,074. The population has increased 4.0% from 2010.
| Year | Population | % Change |
|---|---|---|
| 2023 | 10,074 | 0.1% |
| 2022 | 10,067 | 0.4% |
| 2021 | 10,025 | 4.3% |
| 2020 | 9,610 | 0.3% |
| 2019 | 9,580 | -0.2% |
| 2018 | 9,597 | 0.9% |
| 2017 | 9,514 | 0.1% |
| 2016 | 9,507 | 0.1% |
| 2015 | 9,502 | -0.4% |
| 2014 | 9,543 | 0.0% |
| 2013 | 9,539 | 0.0% |
| 2012 | 9,537 | -0.6% |
| 2011 | 9,594 | -0.9% |
| 2010 | 9,685 | - |
Race / Ethnicity in Howell
Howell is:
86.3% White with 8,695 White residents.
1.1% African American with 115 African American residents.
0.3% American Indian with 27 American Indian residents.
0.8% Asian with 83 Asian residents.
0.0% Hawaiian with 0 Hawaiian residents.
0.1% Other with 10 Other residents.
2.1% Two Or More with 207 Two Or More residents.
9.3% Hispanic with 937 Hispanic residents.
| Race | Howell | MI | USA |
|---|---|---|---|
| White | 86.3% | 73.0% | 58.2% |
| African American | 1.1% | 13.2% | 12.0% |
| American Indian | 0.3% | 0.3% | 0.5% |
| Asian | 0.8% | 3.3% | 5.7% |
| Hawaiian | 0.0% | 0.0% | 0.2% |
| Other | 0.1% | 0.4% | 0.5% |
| Two Or More | 2.1% | 4.1% | 3.9% |
| Hispanic | 9.3% | 5.7% | 19.0% |
Gender in Howell
Howell is 51.0% female with 5,139 female residents.
Howell is 49.0% male with 4,935 male residents.
| Gender | Howell | MI | USA |
|---|---|---|---|
| Female | 51.0% | 50.4% | 50.5% |
| Male | 49.0% | 49.6% | 49.5% |
Highest level of educational attainment in Howell for adults over 25
1.0% of adults in Howell completed < 9th grade.
6.0% of adults in Howell completed 9-12th grade.
30.0% of adults in Howell completed high school / ged.
24.0% of adults in Howell completed some college.
11.0% of adults in Howell completed associate's degree.
18.0% of adults in Howell completed bachelor's degree.
8.0% of adults in Howell completed master's degree.
1.0% of adults in Howell completed professional degree.
1.0% of adults in Howell completed doctorate degree.
| Education | Howell | MI | USA |
|---|---|---|---|
| < 9th Grade | 1.0% | 3.0% | 5.0% |
| 9-12th Grade | 6.0% | 6.0% | 6.0% |
| High School / GED | 30.0% | 28.0% | 26.0% |
| Some College | 24.0% | 22.0% | 19.0% |
| Associate's Degree | 11.0% | 10.0% | 9.0% |
| Bachelor's Degree | 18.0% | 19.0% | 21.0% |
| Master's Degree | 8.0% | 9.0% | 10.0% |
| Professional Degree | 1.0% | 2.0% | 2.0% |
| Doctorate Degree | 1.0% | 1.0% | 2.0% |
Household Income For Howell, Michigan
1.2% of households in Howell earn Less than $10,000.
4.1% of households in Howell earn $10,000 to $14,999.
9.3% of households in Howell earn $15,000 to $24,999.
7.7% of households in Howell earn $25,000 to $34,999.
19.9% of households in Howell earn $35,000 to $49,999.
19.0% of households in Howell earn $50,000 to $74,999.
13.5% of households in Howell earn $75,000 to $99,999.
17.2% of households in Howell earn $100,000 to $149,999.
2.3% of households in Howell earn $150,000 to $199,999.
5.7% of households in Howell earn $200,000 or more.
| Income | Howell | MI | USA |
|---|---|---|---|
| Less than $10,000 | 1.2% | 5.0% | 4.9% |
| $10,000 to $14,999 | 4.1% | 3.9% | 3.6% |
| $15,000 to $24,999 | 9.3% | 7.1% | 6.6% |
| $25,000 to $34,999 | 7.7% | 7.6% | 6.8% |
| $35,000 to $49,999 | 19.9% | 11.8% | 10.4% |
| $50,000 to $74,999 | 19.0% | 16.9% | 15.7% |
| $75,000 to $99,999 | 13.5% | 13.4% | 12.7% |
| $100,000 to $149,999 | 17.2% | 16.9% | 17.4% |
| $150,000 to $199,999 | 2.3% | 8.3% | 9.3% |
| $200,000 or more | 5.7% | 9.0% | 12.6% |


