Southfield, MI
Demographics And Statistics
Living In Southfield, Michigan Summary
Life in Southfield research summary. HomeSnacks has been using Saturday Night Science to research the quality of life in Southfield over the past nine years using Census, FBI, Zillow, and other primary data sources. Based on the most recently available data, we found the following about life in Southfield:
The population in Southfield is 76,025.
The median home value in Southfield is $249,275.
The median income in Southfield is $65,848.
The cost of living in Southfield is 101 which is 1.0x higher than the national average.
The median rent in Southfield is $1,301.
The unemployment rate in Southfield is 6.9%.
The poverty rate in Southfield is 11.2%.
The average high in Southfield is 58.6° and the average low is 40.5°.
Southfield SnackAbility
Overall SnackAbility
Southfield, MI Crime Report
Crime in Southfield summary. We use data from the FBI to determine the crime rates in Southfield. Key points include:
There were 2,198 total crimes in Southfield in the last reporting year.
The overall crime rate per 100,000 people in Southfield is 2,913.0 / 100k people.
The violent crime rate per 100,000 people in Southfield is 493.0 / 100k people.
The property crime rate per 100,000 people in Southfield is 2,420.0 / 100k people.
Overall, crime in Southfield is 37.46% above the national average.
Total Crimes
Above National Average
Crime In Southfield Comparison Table
| Statistic | Count Raw |
Southfield / 100k People |
Michigan / 100k People |
National / 100k People |
|---|---|---|---|---|
| Total Crimes Per 100K | 2,198 | 2,913.0 | 1,813.2 | 2,119.2 |
| Violent Crime | 372 | 493.0 | 434.3 | 359.0 |
| Murder | 1 | 1.3 | 5.2 | 5.0 |
| Robbery | 30 | 39.8 | 31.3 | 61.0 |
| Aggravated Assault | 296 | 392.3 | 341.3 | 256.0 |
| Property Crime | 1,826 | 2,420.0 | 1,378.9 | 1,760.0 |
| Burglary | 306 | 405.5 | 184.2 | 229.0 |
| Larceny | 1,107 | 1,467.1 | 963.6 | 1,272.0 |
| Car Theft | 413 | 547.4 | 231.0 | 259.0 |
Southfield, MI Cost Of Living
Cost of living in Southfield summary. We use data on the cost of living to determine how expensive it is to live in Southfield. Real estate prices drive most of the variance in cost of living around Michigan. Key points include:
The cost of living in Southfield is 101 with 100 being average.
The cost of living in Southfield is 1.0x higher than the national average.
The median home value in Southfield is $249,275.
The median income in Southfield is $65,848.
Southfield's Overall Cost Of Living
Higher Than The National Average
Cost Of Living In Southfield Comparison Table
| Living Expense | Southfield | Michigan | National Average | |
|---|---|---|---|---|
| Overall | 101 | 90 | 100 | |
| Services | 101 | 93 | 100 | |
| Groceries | 102 | 97 | 100 | |
| Health | 103 | 91 | 100 | |
| Housing | 100 | 72 | 100 | |
| Transportation | 100 | 96 | 100 | |
| Utilities | 92 | 99 | 100 | |
Southfield, MI Weather
The average high in Southfield is 58.6° and the average low is 40.5°.
There are 72.3 days of precipitation each year.
Expect an average of 32.9 inches of precipitation each year with 35.9 inches of snow.
| Stat | Southfield |
|---|---|
| Average Annual High | 58.6 |
| Average Annual Low | 40.5 |
| Annual Precipitation Days | 72.3 |
| Average Annual Precipitation | 32.9 |
| Average Annual Snowfall | 35.9 |
Average High
Days of Rain
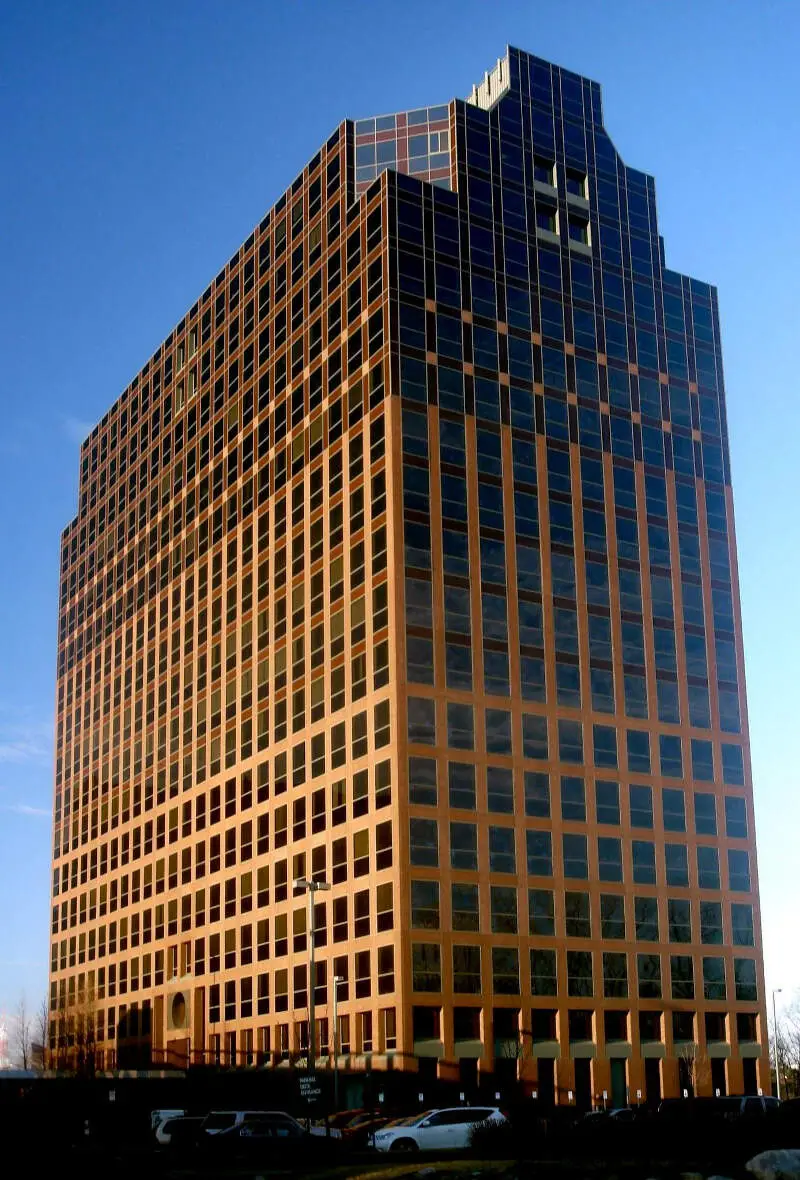
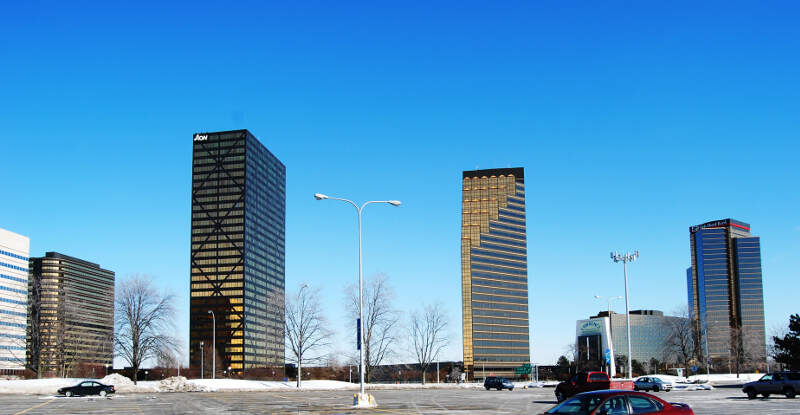
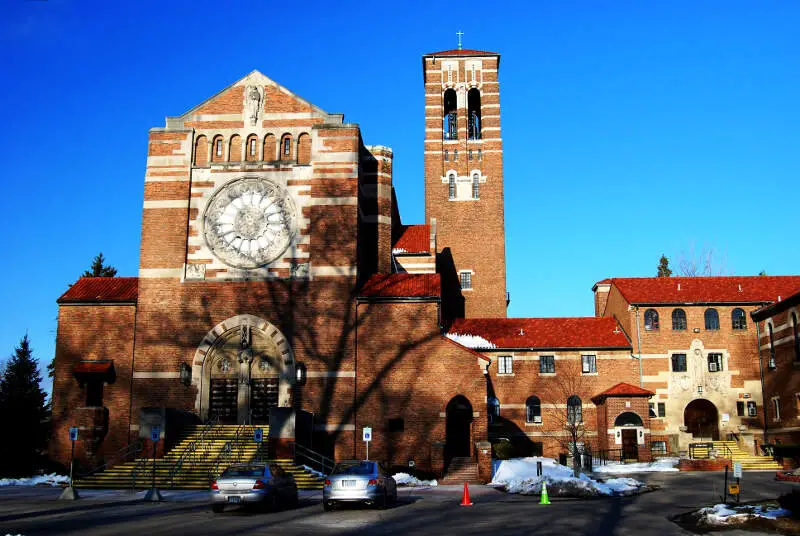
Southfield, MI Photos


Rankings for Southfield in Michigan


Locations Around Southfield
Map Of Southfield, MI
Best Places Around Southfield
Sharon, MA
Population 6,022
Needham, MA
Population 32,059
Newton, MA
Population 88,504
Brookline, MA
Population 62,822
Medfield, MA
Population 6,355
Milton, MA
Population 28,481
Cambridge, MA
Population 117,794
Somerville, MA
Population 80,549
Hingham, MA
Population 5,343
Dedham, MA
Population 25,109
Southfield Demographics And Statistics
Population over time in Southfield
The current population in Southfield is 76,025. The population has increased 4.2% from 2010.
| Year | Population | % Change |
|---|---|---|
| 2023 | 76,025 | -0.1% |
| 2022 | 76,107 | -0.1% |
| 2021 | 76,196 | 4.4% |
| 2020 | 72,966 | -0.3% |
| 2019 | 73,174 | -0.3% |
| 2018 | 73,392 | 0.2% |
| 2017 | 73,228 | 0.2% |
| 2016 | 73,055 | 0.3% |
| 2015 | 72,859 | 0.5% |
| 2014 | 72,480 | 0.2% |
| 2013 | 72,331 | 0.1% |
| 2012 | 72,280 | -0.3% |
| 2011 | 72,502 | -0.6% |
| 2010 | 72,949 | - |
Race / Ethnicity in Southfield
Southfield is:
25.6% White with 19,485 White residents.
63.6% African American with 48,326 African American residents.
0.1% American Indian with 65 American Indian residents.
2.1% Asian with 1,592 Asian residents.
0.1% Hawaiian with 54 Hawaiian residents.
0.5% Other with 379 Other residents.
6.1% Two Or More with 4,663 Two Or More residents.
1.9% Hispanic with 1,461 Hispanic residents.
| Race | Southfield | MI | USA |
|---|---|---|---|
| White | 25.6% | 73.0% | 58.2% |
| African American | 63.6% | 13.2% | 12.0% |
| American Indian | 0.1% | 0.3% | 0.5% |
| Asian | 2.1% | 3.3% | 5.7% |
| Hawaiian | 0.1% | 0.0% | 0.2% |
| Other | 0.5% | 0.4% | 0.5% |
| Two Or More | 6.1% | 4.1% | 3.9% |
| Hispanic | 1.9% | 5.7% | 19.0% |
Gender in Southfield
Southfield is 53.2% female with 40,438 female residents.
Southfield is 46.8% male with 35,587 male residents.
| Gender | Southfield | MI | USA |
|---|---|---|---|
| Female | 53.2% | 50.4% | 50.5% |
| Male | 46.8% | 49.6% | 49.5% |
Highest level of educational attainment in Southfield for adults over 25
1.0% of adults in Southfield completed < 9th grade.
3.0% of adults in Southfield completed 9-12th grade.
20.0% of adults in Southfield completed high school / ged.
27.0% of adults in Southfield completed some college.
9.0% of adults in Southfield completed associate's degree.
21.0% of adults in Southfield completed bachelor's degree.
15.0% of adults in Southfield completed master's degree.
3.0% of adults in Southfield completed professional degree.
1.0% of adults in Southfield completed doctorate degree.
| Education | Southfield | MI | USA |
|---|---|---|---|
| < 9th Grade | 1.0% | 3.0% | 5.0% |
| 9-12th Grade | 3.0% | 6.0% | 6.0% |
| High School / GED | 20.0% | 28.0% | 26.0% |
| Some College | 27.0% | 22.0% | 19.0% |
| Associate's Degree | 9.0% | 10.0% | 9.0% |
| Bachelor's Degree | 21.0% | 19.0% | 21.0% |
| Master's Degree | 15.0% | 9.0% | 10.0% |
| Professional Degree | 3.0% | 2.0% | 2.0% |
| Doctorate Degree | 1.0% | 1.0% | 2.0% |
Household Income For Southfield, Michigan
5.7% of households in Southfield earn Less than $10,000.
4.6% of households in Southfield earn $10,000 to $14,999.
8.0% of households in Southfield earn $15,000 to $24,999.
8.2% of households in Southfield earn $25,000 to $34,999.
11.4% of households in Southfield earn $35,000 to $49,999.
19.4% of households in Southfield earn $50,000 to $74,999.
13.5% of households in Southfield earn $75,000 to $99,999.
15.1% of households in Southfield earn $100,000 to $149,999.
7.9% of households in Southfield earn $150,000 to $199,999.
6.2% of households in Southfield earn $200,000 or more.
| Income | Southfield | MI | USA |
|---|---|---|---|
| Less than $10,000 | 5.7% | 5.0% | 4.9% |
| $10,000 to $14,999 | 4.6% | 3.9% | 3.6% |
| $15,000 to $24,999 | 8.0% | 7.1% | 6.6% |
| $25,000 to $34,999 | 8.2% | 7.6% | 6.8% |
| $35,000 to $49,999 | 11.4% | 11.8% | 10.4% |
| $50,000 to $74,999 | 19.4% | 16.9% | 15.7% |
| $75,000 to $99,999 | 13.5% | 13.4% | 12.7% |
| $100,000 to $149,999 | 15.1% | 16.9% | 17.4% |
| $150,000 to $199,999 | 7.9% | 8.3% | 9.3% |
| $200,000 or more | 6.2% | 9.0% | 12.6% |


