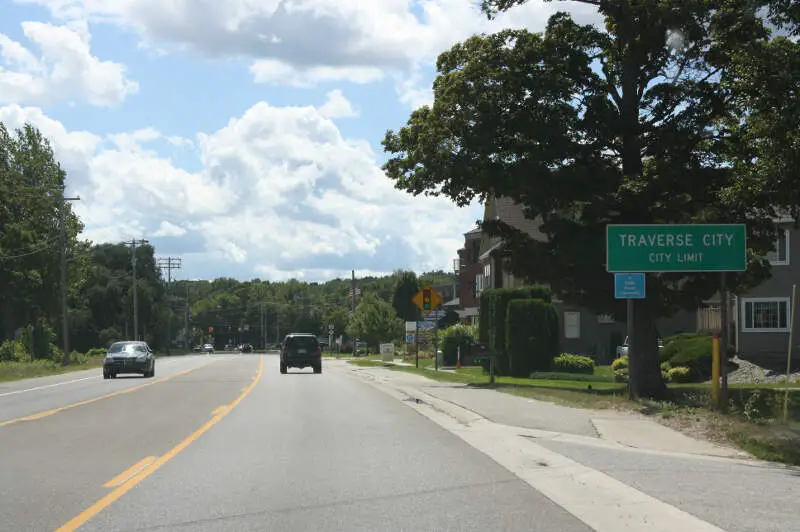
Traverse City, MI
Demographics And Statistics
Living In Traverse City, Michigan Summary
Life in Traverse City research summary. HomeSnacks has been using Saturday Night Science to research the quality of life in Traverse City over the past nine years using Census, FBI, Zillow, and other primary data sources. Based on the most recently available data, we found the following about life in Traverse City:
The population in Traverse City is 15,491.
The median home value in Traverse City is $436,562.
The median income in Traverse City is $71,731.
The cost of living in Traverse City is 108 which is 1.1x higher than the national average.
The median rent in Traverse City is $983.
The unemployment rate in Traverse City is 4.5%.
The poverty rate in Traverse City is 9.1%.
The average high in Traverse City is 54.9° and the average low is 35.5°.
Traverse City SnackAbility
Overall SnackAbility
Traverse City, MI Crime Report
Crime in Traverse City summary. We use data from the FBI to determine the crime rates in Traverse City. Key points include:
There were 207 total crimes in Traverse City in the last reporting year.
The overall crime rate per 100,000 people in Traverse City is 1,317.1 / 100k people.
The violent crime rate per 100,000 people in Traverse City is 286.3 / 100k people.
The property crime rate per 100,000 people in Traverse City is 1,030.8 / 100k people.
Overall, crime in Traverse City is -37.85% below the national average.
Total Crimes
Below National Average
Crime In Traverse City Comparison Table
| Statistic | Count Raw |
Traverse City / 100k People |
Michigan / 100k People |
National / 100k People |
|---|---|---|---|---|
| Total Crimes Per 100K | 207 | 1,317.1 | 1,813.2 | 2,119.2 |
| Violent Crime | 45 | 286.3 | 434.3 | 359.0 |
| Murder | 0 | 0.0 | 5.2 | 5.0 |
| Robbery | 2 | 12.7 | 31.3 | 61.0 |
| Aggravated Assault | 35 | 222.7 | 341.3 | 256.0 |
| Property Crime | 162 | 1,030.8 | 1,378.9 | 1,760.0 |
| Burglary | 15 | 95.4 | 184.2 | 229.0 |
| Larceny | 136 | 865.4 | 963.6 | 1,272.0 |
| Car Theft | 11 | 70.0 | 231.0 | 259.0 |
Traverse City, MI Cost Of Living
Cost of living in Traverse City summary. We use data on the cost of living to determine how expensive it is to live in Traverse City. Real estate prices drive most of the variance in cost of living around Michigan. Key points include:
The cost of living in Traverse City is 108 with 100 being average.
The cost of living in Traverse City is 1.1x higher than the national average.
The median home value in Traverse City is $436,562.
The median income in Traverse City is $71,731.
Traverse City's Overall Cost Of Living
Higher Than The National Average
Cost Of Living In Traverse City Comparison Table
| Living Expense | Traverse City | Michigan | National Average | |
|---|---|---|---|---|
| Overall | 108 | 90 | 100 | |
| Services | 97 | 93 | 100 | |
| Groceries | 97 | 97 | 100 | |
| Health | 96 | 91 | 100 | |
| Housing | 135 | 72 | 100 | |
| Transportation | 100 | 96 | 100 | |
| Utilities | 99 | 99 | 100 | |
Traverse City, MI Weather
The average high in Traverse City is 54.9° and the average low is 35.5°.
There are 75.4 days of precipitation each year.
Expect an average of 31.9 inches of precipitation each year with 113.5 inches of snow.
| Stat | Traverse City |
|---|---|
| Average Annual High | 54.9 |
| Average Annual Low | 35.5 |
| Annual Precipitation Days | 75.4 |
| Average Annual Precipitation | 31.9 |
| Average Annual Snowfall | 113.5 |
Average High
Days of Rain
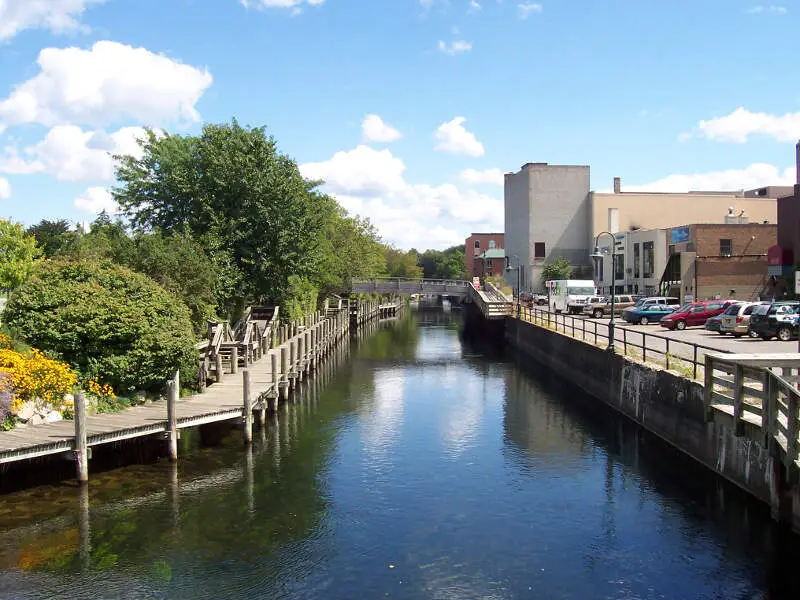
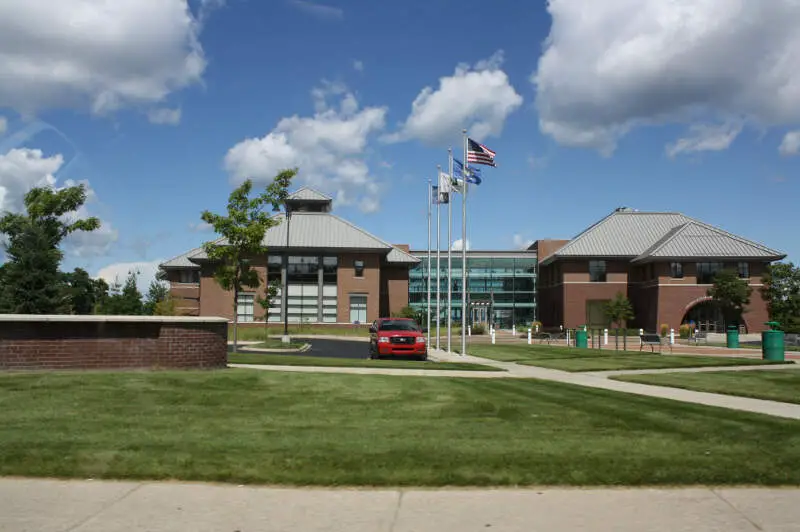
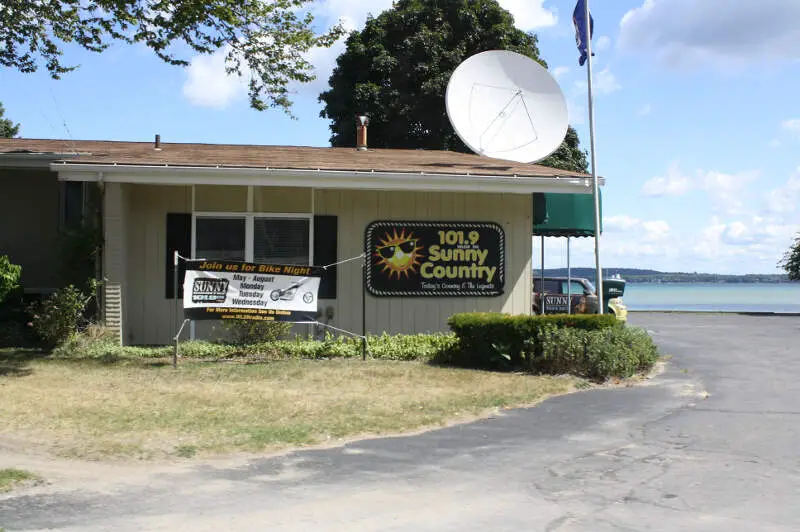
Traverse City, MI Photos


1 Reviews & Comments About Traverse City
/5

HomeSnacks User - None
I live in Traverse City! Could it be that we're one of the few towns in Michigan with people who can actually afford alcohol-
Rankings for Traverse City in Michigan


Locations Around Traverse City
Map Of Traverse City, MI
Best Places Around Traverse City
Traverse City Demographics And Statistics
Population over time in Traverse City
The current population in Traverse City is 15,491. The population has increased 4.9% from 2010.
| Year | Population | % Change |
|---|---|---|
| 2023 | 15,491 | 0.1% |
| 2022 | 15,468 | 1.3% |
| 2021 | 15,263 | -1.7% |
| 2020 | 15,525 | -0.3% |
| 2019 | 15,570 | 0.6% |
| 2018 | 15,474 | -0.5% |
| 2017 | 15,550 | 1.0% |
| 2016 | 15,392 | 1.5% |
| 2015 | 15,168 | 1.1% |
| 2014 | 15,006 | 0.4% |
| 2013 | 14,942 | 1.6% |
| 2012 | 14,702 | -0.1% |
| 2011 | 14,711 | -0.4% |
| 2010 | 14,772 | - |
Race / Ethnicity in Traverse City
Traverse City is:
89.0% White with 13,784 White residents.
1.7% African American with 265 African American residents.
0.3% American Indian with 50 American Indian residents.
1.5% Asian with 227 Asian residents.
0.0% Hawaiian with 0 Hawaiian residents.
0.0% Other with 0 Other residents.
3.4% Two Or More with 521 Two Or More residents.
4.2% Hispanic with 644 Hispanic residents.
| Race | Traverse City | MI | USA |
|---|---|---|---|
| White | 89.0% | 73.0% | 58.2% |
| African American | 1.7% | 13.2% | 12.0% |
| American Indian | 0.3% | 0.3% | 0.5% |
| Asian | 1.5% | 3.3% | 5.7% |
| Hawaiian | 0.0% | 0.0% | 0.2% |
| Other | 0.0% | 0.4% | 0.5% |
| Two Or More | 3.4% | 4.1% | 3.9% |
| Hispanic | 4.2% | 5.7% | 19.0% |
Gender in Traverse City
Traverse City is 51.7% female with 8,009 female residents.
Traverse City is 48.3% male with 7,481 male residents.
| Gender | Traverse City | MI | USA |
|---|---|---|---|
| Female | 51.7% | 50.4% | 50.5% |
| Male | 48.3% | 49.6% | 49.5% |
Highest level of educational attainment in Traverse City for adults over 25
0.0% of adults in Traverse City completed < 9th grade.
3.0% of adults in Traverse City completed 9-12th grade.
18.0% of adults in Traverse City completed high school / ged.
22.0% of adults in Traverse City completed some college.
9.0% of adults in Traverse City completed associate's degree.
26.0% of adults in Traverse City completed bachelor's degree.
15.0% of adults in Traverse City completed master's degree.
4.0% of adults in Traverse City completed professional degree.
3.0% of adults in Traverse City completed doctorate degree.
| Education | Traverse City | MI | USA |
|---|---|---|---|
| < 9th Grade | 0.0% | 3.0% | 5.0% |
| 9-12th Grade | 3.0% | 6.0% | 6.0% |
| High School / GED | 18.0% | 28.0% | 26.0% |
| Some College | 22.0% | 22.0% | 19.0% |
| Associate's Degree | 9.0% | 10.0% | 9.0% |
| Bachelor's Degree | 26.0% | 19.0% | 21.0% |
| Master's Degree | 15.0% | 9.0% | 10.0% |
| Professional Degree | 4.0% | 2.0% | 2.0% |
| Doctorate Degree | 3.0% | 1.0% | 2.0% |
Household Income For Traverse City, Michigan
6.1% of households in Traverse City earn Less than $10,000.
1.9% of households in Traverse City earn $10,000 to $14,999.
6.9% of households in Traverse City earn $15,000 to $24,999.
8.2% of households in Traverse City earn $25,000 to $34,999.
10.8% of households in Traverse City earn $35,000 to $49,999.
18.1% of households in Traverse City earn $50,000 to $74,999.
15.2% of households in Traverse City earn $75,000 to $99,999.
15.7% of households in Traverse City earn $100,000 to $149,999.
7.9% of households in Traverse City earn $150,000 to $199,999.
9.3% of households in Traverse City earn $200,000 or more.
| Income | Traverse City | MI | USA |
|---|---|---|---|
| Less than $10,000 | 6.1% | 5.0% | 4.9% |
| $10,000 to $14,999 | 1.9% | 3.9% | 3.6% |
| $15,000 to $24,999 | 6.9% | 7.1% | 6.6% |
| $25,000 to $34,999 | 8.2% | 7.6% | 6.8% |
| $35,000 to $49,999 | 10.8% | 11.8% | 10.4% |
| $50,000 to $74,999 | 18.1% | 16.9% | 15.7% |
| $75,000 to $99,999 | 15.2% | 13.4% | 12.7% |
| $100,000 to $149,999 | 15.7% | 16.9% | 17.4% |
| $150,000 to $199,999 | 7.9% | 8.3% | 9.3% |
| $200,000 or more | 9.3% | 9.0% | 12.6% |


