Stillwater, MN
Demographics And Statistics
Living In Stillwater, Minnesota Summary
Life in Stillwater research summary. HomeSnacks has been using Saturday Night Science to research the quality of life in Stillwater over the past nine years using Census, FBI, Zillow, and other primary data sources. Based on the most recently available data, we found the following about life in Stillwater:
The population in Stillwater is 19,323.
The median home value in Stillwater is $438,935.
The median income in Stillwater is $109,297.
The cost of living in Stillwater is 113 which is 1.1x higher than the national average.
The median rent in Stillwater is $1,408.
The unemployment rate in Stillwater is 2.9%.
The poverty rate in Stillwater is 7.7%.
The average high in Stillwater is 55.1° and the average low is 35.8°.
Stillwater SnackAbility
Overall SnackAbility
Stillwater, MN Crime Report
Crime in Stillwater summary. We use data from the FBI to determine the crime rates in Stillwater. Key points include:
There were 146 total crimes in Stillwater in the last reporting year.
The overall crime rate per 100,000 people in Stillwater is 759.9 / 100k people.
The violent crime rate per 100,000 people in Stillwater is 98.9 / 100k people.
The property crime rate per 100,000 people in Stillwater is 661.0 / 100k people.
Overall, crime in Stillwater is -64.14% below the national average.
Total Crimes
Below National Average
Crime In Stillwater Comparison Table
| Statistic | Count Raw |
Stillwater / 100k People |
Minnesota / 100k People |
National / 100k People |
|---|---|---|---|---|
| Total Crimes Per 100K | 146 | 759.9 | 1,862.9 | 2,119.2 |
| Violent Crime | 19 | 98.9 | 256.6 | 359.0 |
| Murder | 0 | 0.0 | 2.9 | 5.0 |
| Robbery | 1 | 5.2 | 48.9 | 61.0 |
| Aggravated Assault | 9 | 46.8 | 168.0 | 256.0 |
| Property Crime | 127 | 661.0 | 1,606.3 | 1,760.0 |
| Burglary | 20 | 104.1 | 184.7 | 229.0 |
| Larceny | 94 | 489.2 | 1,208.5 | 1,272.0 |
| Car Theft | 13 | 67.7 | 213.1 | 259.0 |
Stillwater, MN Cost Of Living
Cost of living in Stillwater summary. We use data on the cost of living to determine how expensive it is to live in Stillwater. Real estate prices drive most of the variance in cost of living around Minnesota. Key points include:
The cost of living in Stillwater is 113 with 100 being average.
The cost of living in Stillwater is 1.1x higher than the national average.
The median home value in Stillwater is $438,935.
The median income in Stillwater is $109,297.
Stillwater's Overall Cost Of Living
Higher Than The National Average
Cost Of Living In Stillwater Comparison Table
| Living Expense | Stillwater | Minnesota | National Average | |
|---|---|---|---|---|
| Overall | 113 | 97 | 100 | |
| Services | 96 | 101 | 100 | |
| Groceries | 97 | 99 | 100 | |
| Health | 102 | 110 | 100 | |
| Housing | 148 | 100 | 100 | |
| Transportation | 98 | 95 | 100 | |
| Utilities | 94 | 94 | 100 | |
Stillwater, MN Weather
The average high in Stillwater is 55.1° and the average low is 35.8°.
There are 66.0 days of precipitation each year.
Expect an average of 33.7 inches of precipitation each year with 49.3 inches of snow.
| Stat | Stillwater |
|---|---|
| Average Annual High | 55.1 |
| Average Annual Low | 35.8 |
| Annual Precipitation Days | 66.0 |
| Average Annual Precipitation | 33.7 |
| Average Annual Snowfall | 49.3 |
Average High
Days of Rain
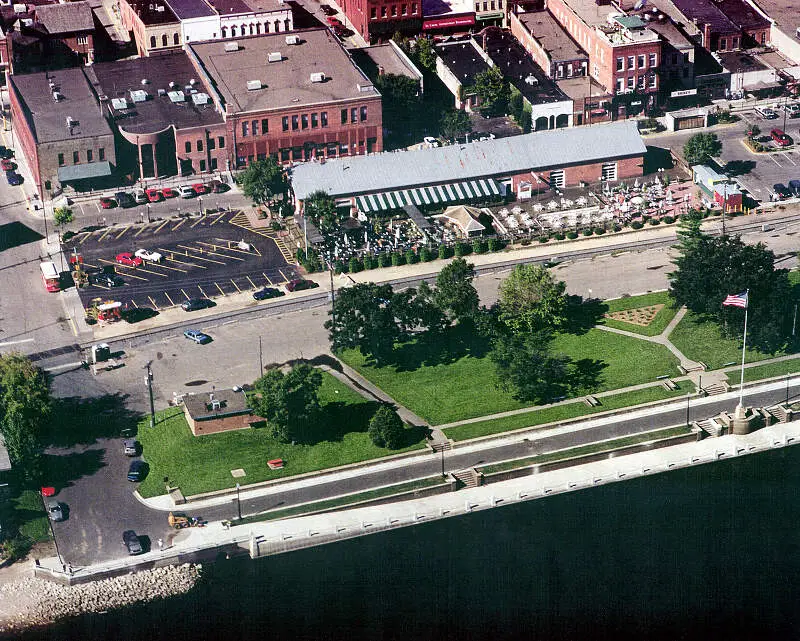
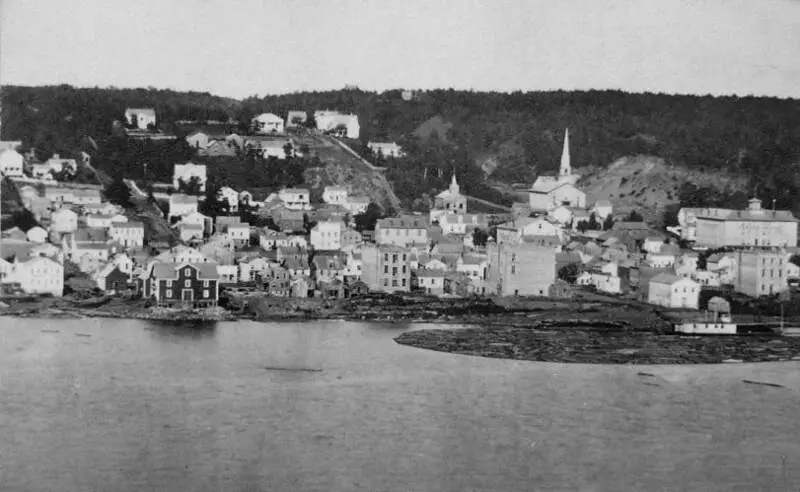
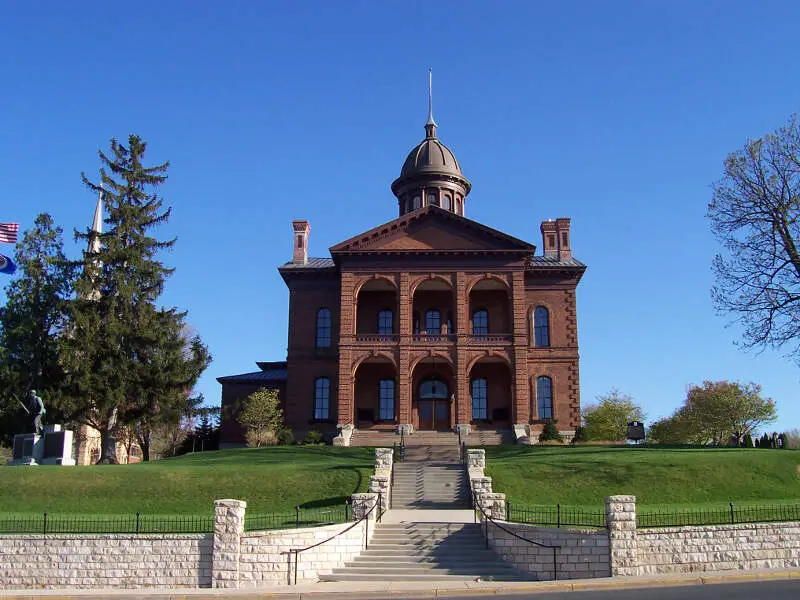
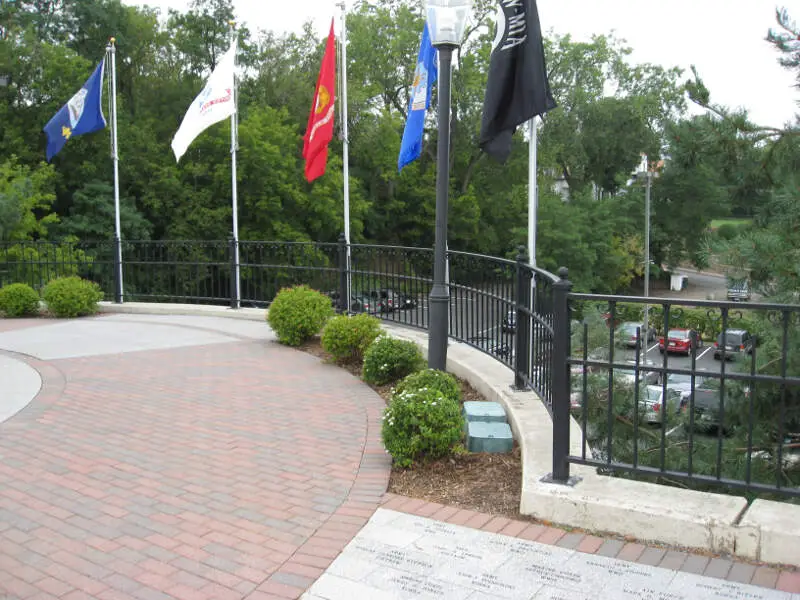
Stillwater, MN Photos
Rankings for Stillwater in Minnesota


Locations Around Stillwater
Map Of Stillwater, MN
Best Places Around Stillwater
Shoreview, MN
Population 26,724
Mahtomedi, MN
Population 8,108
Woodbury, MN
Population 76,945
Mendota Heights, MN
Population 11,644
Lake Elmo, MN
Population 12,504
Cottage Grove, MN
Population 40,124
Arden Hills, MN
Population 9,737
Hugo, MN
Population 16,076
Lino Lakes, MN
Population 21,847
Roseville, MN
Population 35,905
Stillwater Demographics And Statistics
Population over time in Stillwater
The current population in Stillwater is 19,323. The population has increased 8.5% from 2010.
| Year | Population | % Change |
|---|---|---|
| 2023 | 19,323 | 0.0% |
| 2022 | 19,316 | 0.4% |
| 2021 | 19,243 | -1.2% |
| 2020 | 19,471 | 0.7% |
| 2019 | 19,341 | 0.3% |
| 2018 | 19,275 | 0.2% |
| 2017 | 19,232 | 0.5% |
| 2016 | 19,142 | 2.5% |
| 2015 | 18,677 | 0.7% |
| 2014 | 18,541 | 0.8% |
| 2013 | 18,390 | 0.9% |
| 2012 | 18,229 | 0.9% |
| 2011 | 18,058 | 1.4% |
| 2010 | 17,804 | - |
Race / Ethnicity in Stillwater
Stillwater is:
84.0% White with 16,232 White residents.
1.5% African American with 281 African American residents.
0.2% American Indian with 46 American Indian residents.
3.1% Asian with 595 Asian residents.
0.0% Hawaiian with 7 Hawaiian residents.
0.5% Other with 101 Other residents.
3.4% Two Or More with 664 Two Or More residents.
7.2% Hispanic with 1,397 Hispanic residents.
| Race | Stillwater | MN | USA |
|---|---|---|---|
| White | 84.0% | 76.7% | 58.2% |
| African American | 1.5% | 6.7% | 12.0% |
| American Indian | 0.2% | 0.7% | 0.5% |
| Asian | 3.1% | 5.0% | 5.7% |
| Hawaiian | 0.0% | 0.0% | 0.2% |
| Other | 0.5% | 0.4% | 0.5% |
| Two Or More | 3.4% | 4.1% | 3.9% |
| Hispanic | 7.2% | 6.2% | 19.0% |
Gender in Stillwater
Stillwater is 50.2% female with 9,700 female residents.
Stillwater is 49.8% male with 9,623 male residents.
| Gender | Stillwater | MN | USA |
|---|---|---|---|
| Female | 50.2% | 49.9% | 50.5% |
| Male | 49.8% | 50.1% | 49.5% |
Highest level of educational attainment in Stillwater for adults over 25
3.0% of adults in Stillwater completed < 9th grade.
1.0% of adults in Stillwater completed 9-12th grade.
17.0% of adults in Stillwater completed high school / ged.
19.0% of adults in Stillwater completed some college.
10.0% of adults in Stillwater completed associate's degree.
30.0% of adults in Stillwater completed bachelor's degree.
14.0% of adults in Stillwater completed master's degree.
3.0% of adults in Stillwater completed professional degree.
3.0% of adults in Stillwater completed doctorate degree.
| Education | Stillwater | MN | USA |
|---|---|---|---|
| < 9th Grade | 3.0% | 2.0% | 5.0% |
| 9-12th Grade | 1.0% | 3.0% | 6.0% |
| High School / GED | 17.0% | 24.0% | 26.0% |
| Some College | 19.0% | 20.0% | 19.0% |
| Associate's Degree | 10.0% | 12.0% | 9.0% |
| Bachelor's Degree | 30.0% | 25.0% | 21.0% |
| Master's Degree | 14.0% | 10.0% | 10.0% |
| Professional Degree | 3.0% | 2.0% | 2.0% |
| Doctorate Degree | 3.0% | 2.0% | 2.0% |
Household Income For Stillwater, Minnesota
3.2% of households in Stillwater earn Less than $10,000.
2.7% of households in Stillwater earn $10,000 to $14,999.
4.3% of households in Stillwater earn $15,000 to $24,999.
3.4% of households in Stillwater earn $25,000 to $34,999.
8.2% of households in Stillwater earn $35,000 to $49,999.
10.9% of households in Stillwater earn $50,000 to $74,999.
12.0% of households in Stillwater earn $75,000 to $99,999.
22.4% of households in Stillwater earn $100,000 to $149,999.
14.3% of households in Stillwater earn $150,000 to $199,999.
18.4% of households in Stillwater earn $200,000 or more.
| Income | Stillwater | MN | USA |
|---|---|---|---|
| Less than $10,000 | 3.2% | 3.5% | 4.9% |
| $10,000 to $14,999 | 2.7% | 2.8% | 3.6% |
| $15,000 to $24,999 | 4.3% | 5.4% | 6.6% |
| $25,000 to $34,999 | 3.4% | 5.8% | 6.8% |
| $35,000 to $49,999 | 8.2% | 9.6% | 10.4% |
| $50,000 to $74,999 | 10.9% | 15.7% | 15.7% |
| $75,000 to $99,999 | 12.0% | 13.5% | 12.7% |
| $100,000 to $149,999 | 22.4% | 19.7% | 17.4% |
| $150,000 to $199,999 | 14.3% | 10.9% | 9.3% |
| $200,000 or more | 18.4% | 13.1% | 12.6% |


