Waconia, MN
Demographics And Statistics
Living In Waconia, Minnesota Summary
Life in Waconia research summary. HomeSnacks has been using Saturday Night Science to research the quality of life in Waconia over the past nine years using Census, FBI, Zillow, and other primary data sources. Based on the most recently available data, we found the following about life in Waconia:
The population in Waconia is 13,223.
The median home value in Waconia is $450,883.
The median income in Waconia is $104,929.
The cost of living in Waconia is 115 which is 1.1x higher than the national average.
The median rent in Waconia is $1,299.
The unemployment rate in Waconia is 4.1%.
The poverty rate in Waconia is 4.2%.
The average high in Waconia is 54.5° and the average low is 35.2°.
Table Of Contents
Waconia SnackAbility
Overall SnackAbility
Waconia, MN Cost Of Living
Cost of living in Waconia summary. We use data on the cost of living to determine how expensive it is to live in Waconia. Real estate prices drive most of the variance in cost of living around Minnesota. Key points include:
The cost of living in Waconia is 115 with 100 being average.
The cost of living in Waconia is 1.1x higher than the national average.
The median home value in Waconia is $450,883.
The median income in Waconia is $104,929.
Waconia's Overall Cost Of Living
Higher Than The National Average
Cost Of Living In Waconia Comparison Table
| Living Expense | Waconia | Minnesota | National Average | |
|---|---|---|---|---|
| Overall | 115 | 97 | 100 | |
| Services | 96 | 101 | 100 | |
| Groceries | 95 | 99 | 100 | |
| Health | 103 | 110 | 100 | |
| Housing | 154 | 100 | 100 | |
| Transportation | 97 | 95 | 100 | |
| Utilities | 96 | 94 | 100 | |
Waconia, MN Weather
The average high in Waconia is 54.5° and the average low is 35.2°.
There are 58.0 days of precipitation each year.
Expect an average of 30.5 inches of precipitation each year with 48.7 inches of snow.
| Stat | Waconia |
|---|---|
| Average Annual High | 54.5 |
| Average Annual Low | 35.2 |
| Annual Precipitation Days | 58.0 |
| Average Annual Precipitation | 30.5 |
| Average Annual Snowfall | 48.7 |
Average High
Days of Rain
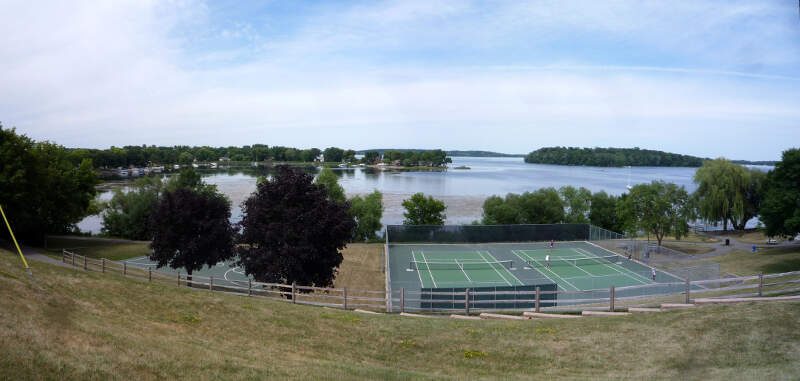
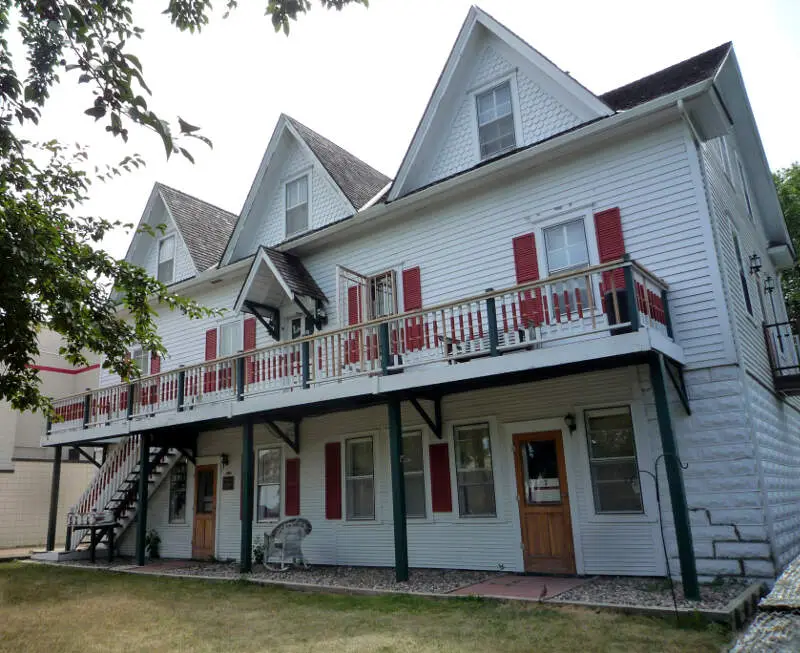
Waconia, MN Photos


Rankings for Waconia in Minnesota


Locations Around Waconia
Map Of Waconia, MN
Best Places Around Waconia
Eden Prairie, MN
Population 63,249
Shorewood, MN
Population 7,679
Minnetonka, MN
Population 53,256
Minnetrista, MN
Population 8,509
Victoria, MN
Population 10,972
Mound, MN
Population 9,176
Chanhassen, MN
Population 26,001
Orono, MN
Population 8,205
Prior Lake, MN
Population 27,832
Jordan, MN
Population 6,704
Waconia Demographics And Statistics
Population over time in Waconia
The current population in Waconia is 13,223. The population has increased 30.2% from 2010.
| Year | Population | % Change |
|---|---|---|
| 2023 | 13,223 | 1.8% |
| 2022 | 12,993 | 1.7% |
| 2021 | 12,773 | 4.0% |
| 2020 | 12,281 | 1.2% |
| 2019 | 12,131 | 1.3% |
| 2018 | 11,981 | 2.0% |
| 2017 | 11,751 | 2.0% |
| 2016 | 11,523 | 0.3% |
| 2015 | 11,494 | 2.4% |
| 2014 | 11,230 | 2.3% |
| 2013 | 10,977 | 2.5% |
| 2012 | 10,707 | 2.7% |
| 2011 | 10,429 | 2.7% |
| 2010 | 10,159 | - |
Race / Ethnicity in Waconia
Waconia is:
91.1% White with 12,049 White residents.
1.2% African American with 161 African American residents.
0.0% American Indian with 0 American Indian residents.
0.0% Asian with 6 Asian residents.
0.0% Hawaiian with 0 Hawaiian residents.
0.0% Other with 0 Other residents.
2.8% Two Or More with 373 Two Or More residents.
4.8% Hispanic with 634 Hispanic residents.
| Race | Waconia | MN | USA |
|---|---|---|---|
| White | 91.1% | 76.7% | 58.2% |
| African American | 1.2% | 6.7% | 12.0% |
| American Indian | 0.0% | 0.7% | 0.5% |
| Asian | 0.0% | 5.0% | 5.7% |
| Hawaiian | 0.0% | 0.0% | 0.2% |
| Other | 0.0% | 0.4% | 0.5% |
| Two Or More | 2.8% | 4.1% | 3.9% |
| Hispanic | 4.8% | 6.2% | 19.0% |
Gender in Waconia
Waconia is 50.0% female with 6,607 female residents.
Waconia is 50.0% male with 6,615 male residents.
| Gender | Waconia | MN | USA |
|---|---|---|---|
| Female | 50.0% | 49.9% | 50.5% |
| Male | 50.0% | 50.1% | 49.5% |
Highest level of educational attainment in Waconia for adults over 25
1.0% of adults in Waconia completed < 9th grade.
1.0% of adults in Waconia completed 9-12th grade.
17.0% of adults in Waconia completed high school / ged.
21.0% of adults in Waconia completed some college.
10.0% of adults in Waconia completed associate's degree.
35.0% of adults in Waconia completed bachelor's degree.
11.0% of adults in Waconia completed master's degree.
2.0% of adults in Waconia completed professional degree.
2.0% of adults in Waconia completed doctorate degree.
| Education | Waconia | MN | USA |
|---|---|---|---|
| < 9th Grade | 1.0% | 2.0% | 5.0% |
| 9-12th Grade | 1.0% | 3.0% | 6.0% |
| High School / GED | 17.0% | 24.0% | 26.0% |
| Some College | 21.0% | 20.0% | 19.0% |
| Associate's Degree | 10.0% | 12.0% | 9.0% |
| Bachelor's Degree | 35.0% | 25.0% | 21.0% |
| Master's Degree | 11.0% | 10.0% | 10.0% |
| Professional Degree | 2.0% | 2.0% | 2.0% |
| Doctorate Degree | 2.0% | 2.0% | 2.0% |
Household Income For Waconia, Minnesota
2.7% of households in Waconia earn Less than $10,000.
2.2% of households in Waconia earn $10,000 to $14,999.
2.5% of households in Waconia earn $15,000 to $24,999.
9.1% of households in Waconia earn $25,000 to $34,999.
7.8% of households in Waconia earn $35,000 to $49,999.
12.1% of households in Waconia earn $50,000 to $74,999.
9.0% of households in Waconia earn $75,000 to $99,999.
18.6% of households in Waconia earn $100,000 to $149,999.
18.0% of households in Waconia earn $150,000 to $199,999.
17.9% of households in Waconia earn $200,000 or more.
| Income | Waconia | MN | USA |
|---|---|---|---|
| Less than $10,000 | 2.7% | 3.5% | 4.9% |
| $10,000 to $14,999 | 2.2% | 2.8% | 3.6% |
| $15,000 to $24,999 | 2.5% | 5.4% | 6.6% |
| $25,000 to $34,999 | 9.1% | 5.8% | 6.8% |
| $35,000 to $49,999 | 7.8% | 9.6% | 10.4% |
| $50,000 to $74,999 | 12.1% | 15.7% | 15.7% |
| $75,000 to $99,999 | 9.0% | 13.5% | 12.7% |
| $100,000 to $149,999 | 18.6% | 19.7% | 17.4% |
| $150,000 to $199,999 | 18.0% | 10.9% | 9.3% |
| $200,000 or more | 17.9% | 13.1% | 12.6% |


