Most African American cities in Massachusetts research summary. We used Saturday Night Science to analyze Massachusetts’s most recent Census data to determine the cities with the largest Black population, based on the percentage of Black residents.
The city with the largest African American population in Massachusetts is Brockton (33.5% Black); the least is Newburyport (0.4%). Statewide, Massachusetts is 6.4% Black — the 27th blackest state in the country.
Roughly 42 million people identifying as Black or African American live in the United States, about 12% of the total population. In Massachusetts, the Black population is 450,251, at 6.4% of the state total.
We broke down the most recent Census data to determine the cities in Massachusetts with the largest African American population in 2026.
#1 most African American in Massachusetts
Brockton is a city in Plymouth County, Massachusetts, United States; the population was 95,314 in the 2015 Census. Brockton, along with Plymouth, are the county seats of Plymouth County. Brockton is the seventh largest city in Massachusetts and is sometimes referred to as the “City of Champions”, due to the success of native boxers Rocky Marciano and Marvin Hagler, as well as its successful Brockton High School sports programs. Two of the villages within the city are Montello and Campello, both have the distinction of having their own MBTA Commuter Rail Stations and post offices. Campello is the smallest neighborhood in the city, but also the most populous. Brockton hosts a baseball team, the Brockton Rox. Brockton is one of the windiest cities in the United States, with an average wind speed of 14.3mph.
Data | Crime | Cost of living | Movers
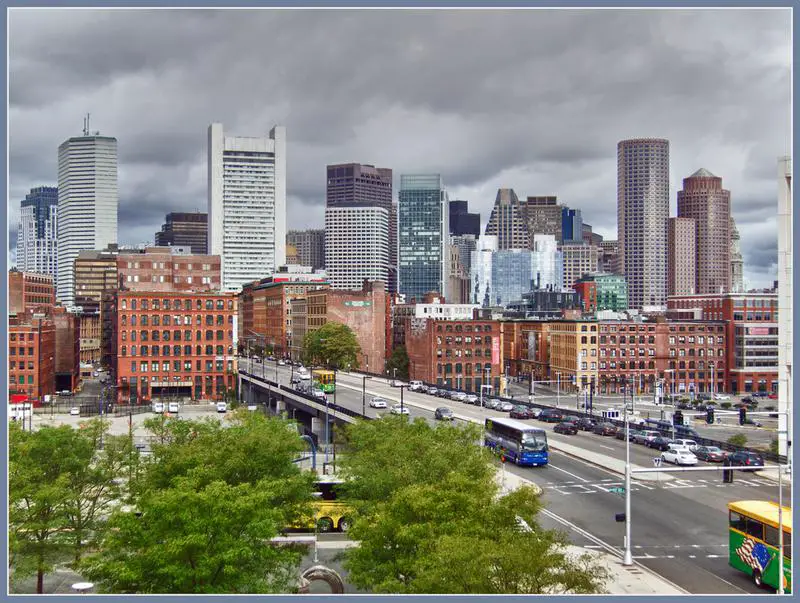
#2 most African American in Massachusetts
Boston BOSS-tn) is the capital city and most populous municipality of the Commonwealth of Massachusetts in the United States. It is also the seat of Suffolk County, although the county government was disbanded on July 1, 1999. The city proper covers 48 square miles with an estimated population of 673,184 in 2016, making it the largest city in the New England region of the northeastern United States. The city is the economic and cultural anchor of a substantially larger metropolitan area known as Greater Boston, a metropolitan statistical area home to a census-estimated 4.8million people in 2016 and ranking as the tenth-largest such area in the country. As a combined statistical area, this wider commuting region is home to some 8.2million people, making it the sixth-largest in the United States.
Data | Crime | Cost of living | Movers | Compare
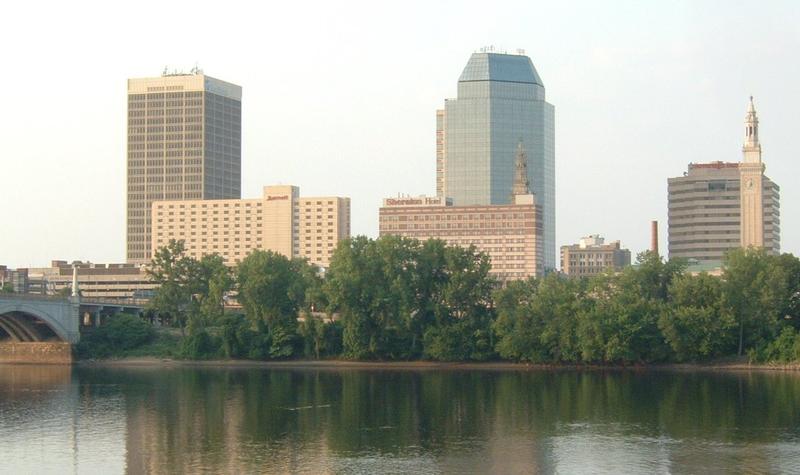
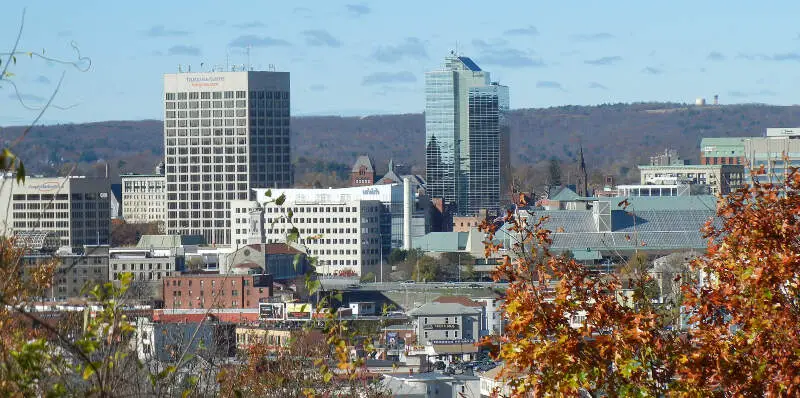
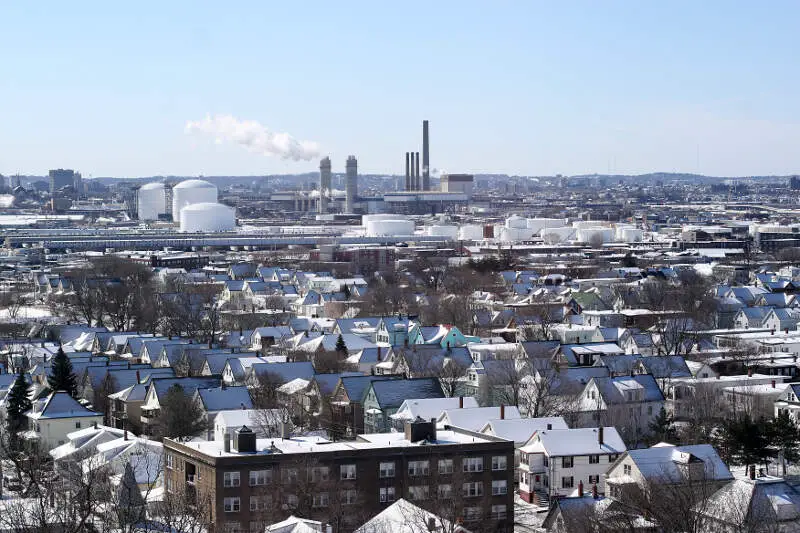
#3 most African American in Massachusetts
Springfield is a city in western New England, and the seat of Hampden County, Massachusetts, United States. Springfield sits on the eastern bank of the Connecticut River near its confluence with three rivers: the western Westfield River, the eastern Chicopee River, and the eastern Mill River. As of the 2010 Census, the city’s population was 153,060. Metropolitan Springfield, as one of two metropolitan areas in Massachusetts, had a population of 692,942 as of 2010.
Data | Crime | Cost of living | Movers
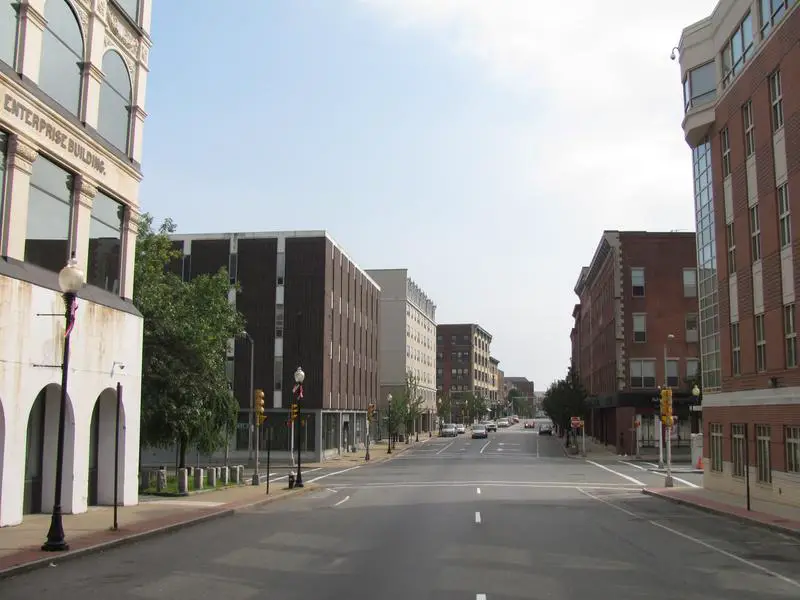
#4 most African American in Massachusetts
Malden is a city in Middlesex County, Massachusetts, United States. At the time of the 2010 United States Census, the population was at 59,450 people. In 2009, Malden was named the “Best Place to Raise Your Kids” in Massachusetts by Bloomberg Businessweek.
Data | Crime | Cost of living | Movers
#5 most African American in Massachusetts
Worcester pronunciation is a city and the county seat of Worcester County, Massachusetts, United States. Named after Worcester, England, as of the 2010 Census the city’s population was 181,045, making it the second most populous city in New England after Boston. Worcester is located approximately 40 miles west of Boston, 50 miles east of Springfield and 40 miles north of Providence. Due to its location in Central Massachusetts, Worcester is known as the “Heart of the Commonwealth”, thus, a heart is the official symbol of the city. However, the heart symbol may also have its provenance in lore that the mass-produced Valentine’s Day card was invented in the city.
Data | Crime | Cost of living | Movers
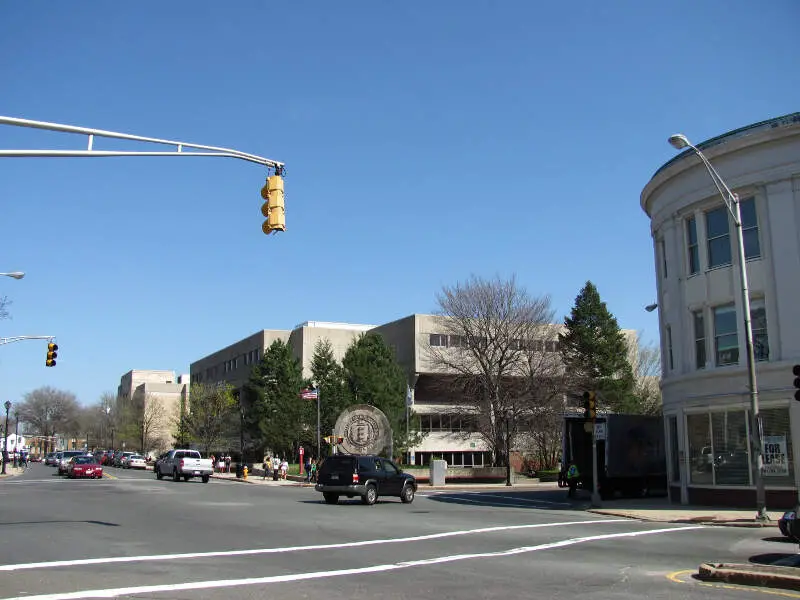
#6 most African American in Massachusetts
Cambridge is a city in Middlesex County, Massachusetts, and part of the Boston metropolitan area.
Data | Crime | Cost of living | Movers
#7 most African American in Massachusetts
Lynn is the 9th largest municipality in Massachusetts and the largest city in Essex County. Situated on the Atlantic Ocean, approximately 10 miles north of downtown Boston, Lynn is part of Greater Boston’s urban inner core. An early colonial settlement and industrial center, Lynn was long colloquially referred to as the “City of Sin,” owing to its historic reputation for crime and vice. Today, however, the city is known for its large international population, historic architecture, downtown cultural district, loft-style apartments, and public parks and open spaces, which include the oceanfront Lynn Shore Reservation; the 2,200-acre, Frederick Law Olmsted-designed Lynn Woods Reservation; and the High Rock Tower Reservation. The city also is home to the southernmost portion of the Essex Coastal Scenic Byway, Lynn Heritage State Park, and the National Register-listed Diamond Historic District.
Data | Crime | Cost of living | Movers
#8 most African American in Massachusetts
Lowell is a city in the U.S. Commonwealth of Massachusetts. Located in Middlesex County, Lowell was a county seat until Massachusetts disbanded county government in 1999. With an estimated population of 109,945 in 2014, it is the fourth-largest city in Massachusetts, and the second-largest in the Boston metropolitan statistical area. The city is also part of a smaller Massachusetts statistical area called Greater Lowell, as well as New England’s Merrimack Valley region.
Data | Crime | Cost of living | Movers
#9 most African American in Massachusetts
Everett is a city in Middlesex County, Massachusetts, United States, 4 miles north of Boston. The population was 41,668 at the time of the 2010 United States Census.
Data | Crime | Cost of living | Movers
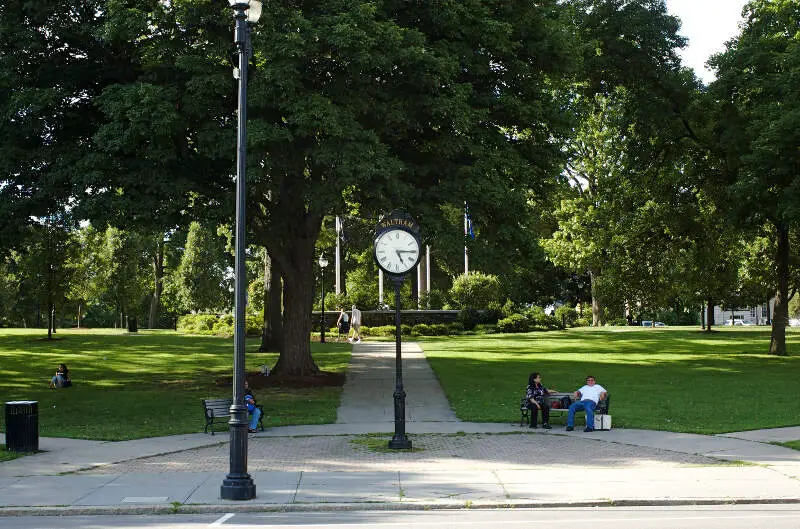
#10 most African American in Massachusetts
Waltham is a city in Middlesex County, Massachusetts, United States, and was an early center for the labor movement as well as a major contributor to the American Industrial Revolution. The original home of the Boston Manufacturing Company, the city was a prototype for 19th century industrial city planning, spawning what became known as the Waltham-Lowell system of labor and production. The city is now a center for research and higher education, home to Brandeis University and Bentley University. The population was 60,636 at the census in 2010.
Data | Crime | Cost of living | Movers
The receipts
Compare the top ten
Pick a metric. The bars rescale. The red line is Massachusetts’s statewide median.
On the map
Where Massachusetts’s Black communities live
Saturday Night Science
Methodology: How We Determined The Cities In Massachusetts With The Largest Black Population For 2026
We still believe in the accuracy of data — especially from the Census. So that’s where we went to get the race breakdown across Massachusetts.
That leads us to the Census’s most recently available data, the 2020-2024 American Community Survey data from the US Census.
Specifically, we looked at table B03002: Hispanic OR LATINO ORIGIN BY RACE. Here are the category names as defined by the Census:
- Hispanic or Latino
- White alone*
- Black or African American alone*
- American Indian and Alaska Native alone*
- Asian alone*
- Native Hawaiian and Other Pacific Islander alone*
- Some other race alone*
- Two or more races*
Our particular column of interest was the number of people who identified as Black or African American.
We limited our analysis to non-CDPs with a population greater than 12,000 people in Massachusetts. That left us with 48 cities.
We then calculated the percentage of residents that are Black or African American. The percentages ranked from 33.5% to 0.4%.
Finally, we ranked each city based on the percentage of the Black population, with a higher score being more Black than a lower score. Brockton took the distinction of being the most Black, while Newburyport was the least African American city.
We updated this article for 2026. This is our eleventh time ranking the cities in Massachusetts with the largest African American population.
The full plate
African American Population By City In Massachusetts
Click any column to sort. Search by city name.
| Rank | City | Population | African American Population | % African American |
|---|---|---|---|---|
| 1 | Brockton | 105,386 | 35,340 | 33.5% |
| 2 | Boston | 666,442 | 128,487 | 19.3% |
| 3 | Springfield | 154,749 | 27,100 | 17.5% |
| 4 | Malden | 65,906 | 8,677 | 13.2% |
| 5 | Worcester | 207,055 | 24,994 | 12.1% |
| 6 | Cambridge | 118,796 | 12,226 | 10.3% |
| 7 | Lynn | 101,709 | 10,150 | 10.0% |
| 8 | Lowell | 118,368 | 11,776 | 9.9% |
| 9 | Everett | 50,045 | 4,718 | 9.4% |
| 10 | Waltham | 64,902 | 5,406 | 8.3% |
| 11 | Taunton | 60,433 | 4,679 | 7.7% |
| 12 | Chelsea | 39,908 | 2,828 | 7.1% |
| 13 | Medford | 59,354 | 3,745 | 6.3% |
| 14 | Quincy | 102,114 | 6,141 | 6.0% |
| 15 | Fitchburg | 41,798 | 2,491 | 6.0% |
| 16 | Barnstable Town | 49,568 | 2,821 | 5.7% |
| 17 | Fall River | 94,082 | 5,304 | 5.6% |
| 18 | Attleboro | 46,762 | 2,583 | 5.5% |
| 19 | Pittsfield | 43,457 | 2,253 | 5.2% |
| 20 | Leominster | 43,909 | 2,135 | 4.9% |
| 21 | Salem | 44,795 | 2,050 | 4.6% |
| 22 | Chicopee | 55,295 | 2,449 | 4.4% |
| 23 | Woburn | 41,939 | 1,857 | 4.4% |
| 24 | Somerville | 81,036 | 3,587 | 4.4% |
| 25 | New Bedford | 100,998 | 4,463 | 4.4% |
| 26 | Revere | 60,012 | 2,629 | 4.4% |
| 27 | Peabody | 54,695 | 2,352 | 4.3% |
| 28 | Weymouth Town | 58,505 | 2,366 | 4.0% |
| 29 | Gardner | 21,148 | 851 | 4.0% |
| 30 | West Springfield Town | 28,772 | 1,096 | 3.8% |
| 31 | Palmer Town | 12,381 | 460 | 3.7% |
| 32 | Marlborough | 41,647 | 1,529 | 3.7% |
| 33 | Braintree Town | 38,899 | 1,308 | 3.4% |
| 34 | Winthrop Town | 18,759 | 598 | 3.2% |
| 35 | Southbridge Town | 17,928 | 525 | 2.9% |
| 36 | Beverly | 42,665 | 1,209 | 2.8% |
| 37 | Agawam Town | 28,539 | 806 | 2.8% |
| 38 | Haverhill | 67,698 | 1,812 | 2.7% |
| 39 | Northampton | 30,962 | 822 | 2.7% |
| 40 | Holyoke | 37,813 | 923 | 2.4% |
| 41 | Newton | 89,044 | 2,108 | 2.4% |
| 42 | Franklin Town | 33,154 | 684 | 2.1% |
| 43 | Lawrence | 88,736 | 1,775 | 2.0% |
| 44 | Melrose | 29,650 | 467 | 1.6% |
| 45 | North Adams | 12,606 | 190 | 1.5% |
| 46 | Gloucester | 30,075 | 405 | 1.3% |
| 47 | Westfield | 40,378 | 287 | 0.7% |
| 48 | Newburyport | 18,652 | 66 | 0.4% |
Source: U.S. Census ACS 2020-2024. 48 cities with more than 12,000 residents.
Summary
Summary: Black Populations Across Massachusetts
If you’re looking for a breakdown of African American populations across Massachusetts according to the most recent data, this is an accurate list.
The blackest cities in Massachusetts are Brockton, Boston, Springfield, Malden, Worcester, Cambridge, Lynn, Lowell, Everett, and Waltham. Not sold on Massachusetts? Take the two-minute Find Your Place quiz and see which state actually fits you.


