
Most Asian cities in Illinois research summary. We analyzed Illinois’s most recent Census data to determine the most Asian cities in Illinois based on the percentage of Asian residents. Here are the results of our analysis:
-
The most Asian city in Illinois is Oak Brook based on the most recent Census data.
-
Oak Brook is 32.73% Asian.
-
The least Asian city in Illinois is Du Quoin.
-
Du Quoin is 0.0% Asian.
-
Illinois is 5.9% Asian.
-
Illinois is the 11th most Asian state in the United States.
Table Of Contents: Top Ten | Methodology | Summary | Table
Here are the cities in Illinois with the largest Asian population in 2026:
Which city in Illinois had the largest Asian population? Oak Brook took the number one overall spot for the largest Asian in Illinois for 2026. 32.73% of Oak Brook identify as Asian.
Read below to see how we crunched the numbers and how your town ranked.
To see where Illinois ranked as a state on diversity, we have a ranking of the most diverse states in America.
And if you already knew these places were Asian, check out the best places to live in Illinois or the most diverse places in Illinois.
The 10 Most Asian Cities In Illinois For 2026

/10
Population: 8,056
% Asian: 32.73%
# Of Asian Residents: 2,637
More on Oak Brook: Data | Crime | Cost Of Living | Movers

/10
Population: 24,619
% Asian: 31.97%
# Of Asian Residents: 7,870
More on Morton Grove: Data | Crime | Cost Of Living | Movers

/10
Population: 42,891
% Asian: 29.74%
# Of Asian Residents: 12,755
More on Buffalo Grove: Data | Crime | Cost Of Living | Movers

/10
Population: 13,112
% Asian: 27.32%
# Of Asian Residents: 3,582
More on Lincolnwood: Data | Crime | Cost Of Living | Movers

/10
Population: 32,808
% Asian: 25.54%
# Of Asian Residents: 8,378
More on Glendale Heights: Data | Crime | Cost Of Living | Movers

/10
Population: 66,219
% Asian: 25.39%
# Of Asian Residents: 16,816
More on Skokie: Data | Crime | Cost Of Living | Movers

/10
Population: 51,175
% Asian: 25.12%
# Of Asian Residents: 12,856
More on Hoffman Estates: Data | Crime | Cost Of Living | Movers

/10
Population: 26,876
% Asian: 24.62%
# Of Asian Residents: 6,618
More on Vernon Hills: Data | Crime | Cost Of Living | Movers

/10
Population: 7,980
% Asian: 24.0%
# Of Asian Residents: 1,915
More on Lincolnshire: Data | Crime | Cost Of Living | Movers

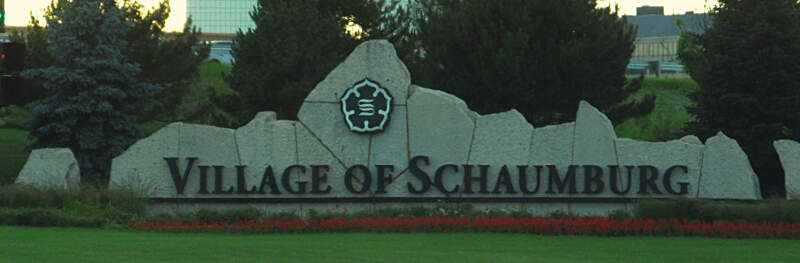
/10
Population: 76,868
% Asian: 23.83%
# Of Asian Residents: 18,318
More on Schaumburg: Data | Crime | Cost Of Living | Movers
Methodology: How We Determined The Cities In Illinois With The Largest Asian Population For 2026
We used Saturday Night Science to compare Census data on race across every place in Illinois.
The Census’s most recently available data comes from the 2020-2024 American Community Survey.
Specifically, we looked at table B03002: Hispanic OR LATINO ORIGIN BY RACE. Here are the category names as defined by the Census:
- Hispanic or Latino
- White alone*
- Black or African American alone*
- American Indian and Alaska Native alone*
- Asian alone*
- Native Hawaiian and Other Pacific Islander alone*
- Some other race alone*
- Two or more races*
Our particular column of interest here was the number of people who identified as Asian alone.
We limited our analysis to cities with a population greater than 5,000 people. That left us with 324 cities.
We then calculated the percentage of residents that are Asian. The percentages ranked from 32.7% to 0.0%.
Finally, we ranked each city based on the percentage of Asian population, with a higher score being more Asian than a lower score. Oak Brook took the distinction of being the most Asian, while Du Quoin was the least Asian city.
We updated this article for 2026. This report reflects our eleventh time ranking the cities in Illinois with the largest Asian population.
Read on for more information on how the cities in Illinois ranked by population of Asian residents or, for a more general take on diversity in America, head over to our ranking of the most diverse cities in America.
Summary: Asian Populations Across Illinois
If you’re looking for a breakdown of Asian populations across Illinois according to the most recent data, this is an accurate list.
The most Asian cities in Illinois are Oak Brook, Morton Grove, Buffalo Grove, Lincolnwood, Glendale Heights, Skokie, Hoffman Estates, Vernon Hills, Lincolnshire, and Schaumburg.
If you’re curious enough, here are the least Asian places in Illinois:
- Du Quoin
- Murphysboro
- Posen
For more Illinois reading, check out:
Table: Asian Population By City In Illinois
| Rank | City | Population | Asian Population | % Asian |
|---|---|---|---|---|
| 1 | Oak Brook | 8,056 | 2,637 | 32.73% |
| 2 | Morton Grove | 24,619 | 7,870 | 31.97% |
| 3 | Buffalo Grove | 42,891 | 12,755 | 29.74% |
| 4 | Lincolnwood | 13,112 | 3,582 | 27.32% |
| 5 | Glendale Heights | 32,808 | 8,378 | 25.54% |
| 6 | Skokie | 66,219 | 16,816 | 25.39% |
| 7 | Hoffman Estates | 51,175 | 12,856 | 25.12% |
| 8 | Vernon Hills | 26,876 | 6,618 | 24.62% |
| 9 | Lincolnshire | 7,980 | 1,915 | 24.0% |
| 10 | Schaumburg | 76,868 | 18,318 | 23.83% |
| 11 | Naperville | 150,692 | 33,649 | 22.33% |
| 12 | Niles | 30,064 | 6,111 | 20.33% |
| 13 | Savoy | 8,968 | 1,819 | 20.28% |
| 14 | Inverness | 7,275 | 1,458 | 20.04% |
| 15 | Bartlett | 40,501 | 7,979 | 19.7% |
| 16 | Carol Stream | 39,460 | 7,618 | 19.31% |
| 17 | Willowbrook | 9,131 | 1,729 | 18.94% |
| 18 | Hanover Park | 36,732 | 6,780 | 18.46% |
| 19 | Lisle | 23,407 | 4,081 | 17.43% |
| 20 | Glenview | 47,752 | 7,737 | 16.2% |
| 21 | Northbrook | 34,585 | 5,594 | 16.17% |
| 22 | Hawthorn Woods | 9,143 | 1,459 | 15.96% |
| 23 | Champaign | 89,996 | 14,204 | 15.78% |
| 24 | Mount Prospect | 55,472 | 8,554 | 15.42% |
| 25 | Wheeling | 38,433 | 5,895 | 15.34% |
| 26 | Des Plaines | 59,156 | 8,797 | 14.87% |
| 27 | Westmont | 23,724 | 3,466 | 14.61% |
| 28 | Burr Ridge | 11,141 | 1,615 | 14.5% |
| 29 | Streamwood | 39,001 | 5,640 | 14.46% |
| 30 | Bloomingdale | 22,457 | 3,236 | 14.41% |
| 31 | Rolling Meadows | 24,027 | 3,431 | 14.28% |
| 32 | Urbana | 39,341 | 5,588 | 14.2% |
| 33 | Bolingbrook | 74,096 | 10,475 | 14.14% |
| 34 | Hinsdale | 17,175 | 2,361 | 13.75% |
| 35 | Itasca | 9,355 | 1,247 | 13.33% |
| 36 | Gurnee | 30,510 | 3,930 | 12.88% |
| 37 | Palatine | 66,293 | 8,318 | 12.55% |
| 38 | Long Grove | 8,305 | 1,024 | 12.33% |
| 39 | Wilmette | 27,503 | 3,376 | 12.28% |
| 40 | Aurora | 179,898 | 21,890 | 12.17% |
| 41 | Woodridge | 33,941 | 4,099 | 12.08% |
| 42 | Round Lake | 18,628 | 2,247 | 12.06% |
| 43 | Elk Grove Village | 31,987 | 3,845 | 12.02% |
| 44 | Darien | 21,879 | 2,603 | 11.9% |
| 45 | Lakemoor | 6,467 | 709 | 10.96% |
| 46 | Glen Ellyn | 28,390 | 3,094 | 10.9% |
| 47 | South Elgin | 24,217 | 2,633 | 10.87% |
| 48 | Lombard | 43,619 | 4,659 | 10.68% |
| 49 | Plainfield | 46,708 | 4,903 | 10.5% |
| 50 | Arlington Heights | 76,005 | 7,920 | 10.42% |
| 51 | West Chicago | 25,395 | 2,628 | 10.35% |
| 52 | Harwood Heights | 8,821 | 912 | 10.34% |
| 53 | Mundelein | 31,915 | 3,228 | 10.11% |
| 54 | Clarendon Hills | 8,659 | 848 | 9.79% |
| 55 | Evanston | 76,340 | 7,173 | 9.4% |
| 56 | Roselle | 22,752 | 2,105 | 9.25% |
| 57 | Lindenhurst | 14,417 | 1,291 | 8.95% |
| 58 | Prospect Heights | 15,618 | 1,397 | 8.94% |
| 59 | Forest Park | 13,943 | 1,225 | 8.79% |
| 60 | Addison | 35,489 | 3,059 | 8.62% |
| 61 | Lake Zurich | 19,832 | 1,660 | 8.37% |
| 62 | Bloomington | 78,907 | 6,543 | 8.29% |
| 63 | Northfield | 5,487 | 445 | 8.11% |
| 64 | Barrington | 11,077 | 878 | 7.93% |
| 65 | Elmhurst | 45,671 | 3,546 | 7.76% |
| 66 | Lake Villa | 8,683 | 672 | 7.74% |
| 67 | Carbondale | 22,158 | 1,621 | 7.32% |
| 68 | Chicago | 2,711,226 | 196,435 | 7.25% |
| 69 | Beach Park | 14,115 | 1,013 | 7.18% |
| 70 | Lake In The Hills | 28,800 | 2,064 | 7.17% |
| 71 | Hampshire | 8,524 | 604 | 7.09% |
| 72 | Peoria | 112,169 | 7,398 | 6.6% |
| 73 | Elgin | 114,934 | 7,570 | 6.59% |
| 74 | Gilberts | 8,606 | 562 | 6.53% |
| 75 | Warrenville | 14,718 | 959 | 6.52% |
| 76 | Lake Bluff | 6,041 | 393 | 6.51% |
| 77 | Lake Forest | 19,416 | 1,248 | 6.43% |
| 78 | Park City | 7,827 | 495 | 6.32% |
| 79 | Park Ridge | 38,667 | 2,443 | 6.32% |
| 80 | Orland Park | 57,916 | 3,593 | 6.2% |
| 81 | Romeoville | 41,152 | 2,529 | 6.15% |
| 82 | North Chicago | 30,643 | 1,856 | 6.06% |
| 83 | West Dundee | 7,906 | 461 | 5.83% |
| 84 | Oak Forest | 26,805 | 1,561 | 5.82% |
| 85 | Wheaton | 53,557 | 3,094 | 5.78% |
| 86 | Mahomet | 10,049 | 579 | 5.76% |
| 87 | Deerfield | 19,518 | 1,102 | 5.65% |
| 88 | Downers Grove | 50,054 | 2,819 | 5.63% |
| 89 | Norridge | 15,439 | 859 | 5.56% |
| 90 | River Forest | 11,992 | 659 | 5.5% |
| 91 | Waukegan | 89,076 | 4,836 | 5.43% |
| 92 | Countryside | 6,267 | 340 | 5.43% |
| 93 | Hickory Hills | 14,526 | 786 | 5.41% |
| 94 | Algonquin | 30,067 | 1,581 | 5.26% |
| 95 | Wauconda | 14,027 | 722 | 5.15% |
| 96 | Justice | 12,324 | 632 | 5.13% |
| 97 | Wood Dale | 13,933 | 712 | 5.11% |
| 98 | Oak Park | 53,292 | 2,719 | 5.1% |
| 99 | Winfield | 10,095 | 513 | 5.08% |
| 100 | Grayslake | 20,929 | 1,063 | 5.08% |
| 101 | Huntley | 28,005 | 1,418 | 5.06% |
| 102 | St. Charles | 32,854 | 1,615 | 4.92% |
| 103 | Bridgeview | 16,849 | 803 | 4.77% |
| 104 | River Grove | 10,451 | 488 | 4.67% |
| 105 | Libertyville | 20,525 | 957 | 4.66% |
| 106 | Oswego | 36,375 | 1,612 | 4.43% |
| 107 | Mount Zion | 5,660 | 245 | 4.33% |
| 108 | Monmouth | 8,581 | 355 | 4.14% |
| 109 | Normal | 53,569 | 2,213 | 4.13% |
| 110 | Carpentersville | 37,346 | 1,522 | 4.08% |
| 111 | Dekalb | 40,443 | 1,627 | 4.02% |
| 112 | Fairview Heights | 16,745 | 672 | 4.01% |
| 113 | Summit | 10,846 | 415 | 3.83% |
| 114 | Carterville | 5,818 | 221 | 3.8% |
| 115 | Berwyn | 55,595 | 2,105 | 3.79% |
| 116 | Rock Island | 36,151 | 1,359 | 3.76% |
| 117 | Antioch | 14,859 | 558 | 3.76% |
| 118 | Westchester | 16,436 | 617 | 3.75% |
| 119 | Bourbonnais | 18,078 | 676 | 3.74% |
| 120 | Worth | 10,700 | 400 | 3.74% |
| 121 | Crystal Lake | 40,579 | 1,515 | 3.73% |
| 122 | Rockford | 147,521 | 5,401 | 3.66% |
| 123 | Schiller Park | 11,393 | 413 | 3.63% |
| 124 | Tinley Park | 54,842 | 1,985 | 3.62% |
| 125 | Shiloh | 14,572 | 477 | 3.27% |
| 126 | Villa Park | 22,345 | 730 | 3.27% |
| 127 | Moline | 42,197 | 1,357 | 3.22% |
| 128 | Burbank | 28,739 | 920 | 3.2% |
| 129 | Chicago Ridge | 14,099 | 441 | 3.13% |
| 130 | Chatham | 14,639 | 453 | 3.09% |
| 131 | Northlake | 12,513 | 387 | 3.09% |
| 132 | Yorkville | 23,617 | 722 | 3.06% |
| 133 | Springfield | 113,330 | 3,434 | 3.03% |
| 134 | Loves Park | 23,502 | 700 | 2.98% |
| 135 | Bensenville | 18,603 | 548 | 2.95% |
| 136 | Midlothian | 13,948 | 404 | 2.9% |
| 137 | Zion | 24,600 | 711 | 2.89% |
| 138 | East Moline | 20,904 | 601 | 2.88% |
| 139 | La Grange Park | 13,447 | 383 | 2.85% |
| 140 | Elmwood Park | 23,868 | 677 | 2.84% |
| 141 | Lemont | 17,820 | 502 | 2.82% |
| 142 | Macomb | 14,894 | 409 | 2.75% |
| 143 | Sugar Grove | 9,240 | 246 | 2.66% |
| 144 | Frankfort | 20,651 | 537 | 2.6% |
| 145 | Orland Hills | 6,719 | 174 | 2.59% |
| 146 | O’fallon | 32,262 | 833 | 2.58% |
| 147 | Elburn | 6,354 | 163 | 2.57% |
| 148 | Berkeley | 5,199 | 133 | 2.56% |
| 149 | Winnetka | 12,484 | 319 | 2.56% |
| 150 | Geneva | 21,258 | 541 | 2.54% |
| 151 | Evergreen Park | 19,420 | 490 | 2.52% |
| 152 | Matteson | 18,645 | 451 | 2.42% |
| 153 | Island Lake | 8,014 | 193 | 2.41% |
| 154 | Crest Hill | 20,628 | 496 | 2.4% |
| 155 | Highland Park | 30,398 | 727 | 2.39% |
| 156 | Swansea | 14,710 | 348 | 2.37% |
| 157 | Marion | 16,836 | 398 | 2.36% |
| 158 | Joliet | 150,445 | 3,539 | 2.35% |
| 159 | Franklin Park | 18,197 | 422 | 2.32% |
| 160 | Bartonville | 5,841 | 135 | 2.31% |
| 161 | Maryville | 8,316 | 192 | 2.31% |
| 162 | Lyons | 10,339 | 237 | 2.29% |
| 163 | Morton | 16,595 | 377 | 2.27% |
| 164 | Willow Springs | 5,868 | 133 | 2.27% |
| 165 | Alsip | 18,583 | 419 | 2.25% |
| 166 | Harvey | 20,230 | 455 | 2.25% |
| 167 | Roscoe | 10,706 | 237 | 2.21% |
| 168 | Silvis | 7,955 | 176 | 2.21% |
| 169 | Woodstock | 26,147 | 570 | 2.18% |
| 170 | Mascoutah | 8,816 | 192 | 2.18% |
| 171 | Mount Carmel | 6,854 | 148 | 2.16% |
| 172 | Lansing | 28,284 | 609 | 2.15% |
| 173 | Round Lake Beach | 27,079 | 583 | 2.15% |
| 174 | Shorewood | 18,343 | 391 | 2.13% |
| 175 | Machesney Park | 22,630 | 477 | 2.11% |
| 176 | Highwood | 5,301 | 109 | 2.06% |
| 177 | Montgomery | 21,515 | 442 | 2.05% |
| 178 | Western Springs | 13,446 | 276 | 2.05% |
| 179 | La Grange | 15,998 | 317 | 1.98% |
| 180 | Charleston | 17,062 | 335 | 1.96% |
| 181 | Broadview | 7,896 | 152 | 1.93% |
| 182 | Palos Hills | 18,081 | 348 | 1.92% |
| 183 | North Aurora | 18,696 | 358 | 1.91% |
| 184 | Sycamore | 18,559 | 353 | 1.9% |
| 185 | Galesburg | 29,481 | 559 | 1.9% |
| 186 | Peoria Heights | 5,825 | 109 | 1.87% |
| 187 | Beardstown | 6,169 | 112 | 1.82% |
| 188 | Campton Hills | 10,877 | 191 | 1.76% |
| 189 | Mchenry | 28,074 | 485 | 1.73% |
| 190 | North Riverside | 7,249 | 125 | 1.72% |
| 191 | Waterloo | 11,129 | 189 | 1.7% |
| 192 | Homer Glen | 24,529 | 415 | 1.69% |
| 193 | Oak Lawn | 56,861 | 949 | 1.67% |
| 194 | Edwardsville | 26,474 | 436 | 1.65% |
| 195 | Rockton | 7,974 | 131 | 1.64% |
| 196 | Centralia | 11,856 | 194 | 1.64% |
| 197 | Flossmoor | 9,391 | 151 | 1.61% |
| 198 | Batavia | 27,151 | 417 | 1.54% |
| 199 | Cary | 17,923 | 273 | 1.52% |
| 200 | Pana | 5,217 | 78 | 1.5% |
| 201 | Decatur | 69,815 | 1,029 | 1.47% |
| 202 | Steger | 9,418 | 136 | 1.44% |
| 203 | Alton | 25,279 | 364 | 1.44% |
| 204 | Homewood | 19,294 | 269 | 1.39% |
| 205 | Dixon | 14,910 | 206 | 1.38% |
| 206 | Riverside | 9,039 | 124 | 1.37% |
| 207 | Milan | 5,034 | 68 | 1.35% |
| 208 | Danville | 28,595 | 386 | 1.35% |
| 209 | Lasalle | 9,498 | 128 | 1.35% |
| 210 | Fox Lake | 11,131 | 147 | 1.32% |
| 211 | Maywood | 23,201 | 306 | 1.32% |
| 212 | Pontiac | 11,294 | 147 | 1.3% |
| 213 | Granite City | 26,549 | 345 | 1.3% |
| 214 | Princeton | 7,975 | 102 | 1.28% |
| 215 | Jacksonville | 18,014 | 223 | 1.24% |
| 216 | Freeport | 23,505 | 286 | 1.22% |
| 217 | Taylorville | 10,646 | 129 | 1.21% |
| 218 | Glencoe | 8,701 | 104 | 1.2% |
| 219 | Spring Grove | 5,917 | 70 | 1.18% |
| 220 | Washington | 15,919 | 188 | 1.18% |
| 221 | Collinsville | 24,031 | 280 | 1.17% |
| 222 | Sterling | 14,717 | 171 | 1.16% |
| 223 | Rochelle | 9,529 | 110 | 1.15% |
| 224 | East Peoria | 22,324 | 257 | 1.15% |
| 225 | Effingham | 12,342 | 141 | 1.14% |
| 226 | Melrose Park | 24,549 | 280 | 1.14% |
| 227 | Brookfield | 19,331 | 220 | 1.14% |
| 228 | South Beloit | 7,946 | 90 | 1.13% |
| 229 | Greenville | 7,235 | 81 | 1.12% |
| 230 | Belvidere | 24,752 | 273 | 1.1% |
| 231 | Sandwich | 7,219 | 79 | 1.09% |
| 232 | Crestwood | 10,579 | 115 | 1.09% |
| 233 | East St. Louis | 17,999 | 192 | 1.07% |
| 234 | Lockport | 26,409 | 281 | 1.06% |
| 235 | Pinckneyville | 5,018 | 53 | 1.06% |
| 236 | Bellwood | 18,256 | 191 | 1.05% |
| 237 | Belleville | 41,370 | 428 | 1.03% |
| 238 | Quincy | 39,109 | 404 | 1.03% |
| 239 | South Holland | 20,911 | 212 | 1.01% |
| 240 | Highland | 10,262 | 104 | 1.01% |
| 241 | Geneseo | 6,673 | 67 | 1.0% |
| 242 | Ottawa | 18,447 | 184 | 1.0% |
| 243 | Mount Vernon | 14,090 | 140 | 0.99% |
| 244 | Stickney | 6,952 | 69 | 0.99% |
| 245 | Crete | 8,386 | 80 | 0.95% |
| 246 | Channahon | 13,927 | 125 | 0.9% |
| 247 | Monticello | 6,304 | 55 | 0.87% |
| 248 | Kankakee | 23,996 | 209 | 0.87% |
| 249 | Salem | 7,236 | 63 | 0.87% |
| 250 | Mokena | 20,021 | 170 | 0.85% |
| 251 | Rantoul | 12,421 | 105 | 0.85% |
| 252 | Benton | 6,863 | 57 | 0.83% |
| 253 | Wilmington | 5,494 | 45 | 0.82% |
| 254 | Peru | 9,775 | 79 | 0.81% |
| 255 | Plano | 12,203 | 98 | 0.8% |
| 256 | Genoa | 5,492 | 43 | 0.78% |
| 257 | Olney | 8,577 | 67 | 0.78% |
| 258 | Streator | 12,330 | 96 | 0.78% |
| 259 | Round Lake Park | 7,919 | 61 | 0.77% |
| 260 | Johnsburg | 6,386 | 49 | 0.77% |
| 261 | Glen Carbon | 13,977 | 101 | 0.72% |
| 262 | Minooka | 12,891 | 89 | 0.69% |
| 263 | Bethalto | 9,239 | 63 | 0.68% |
| 264 | New Lenox | 28,006 | 188 | 0.67% |
| 265 | Troy | 11,647 | 78 | 0.67% |
| 266 | Pekin | 31,781 | 212 | 0.67% |
| 267 | Lincoln | 13,281 | 88 | 0.66% |
| 268 | Blue Island | 21,741 | 136 | 0.63% |
| 269 | Godfrey | 17,712 | 109 | 0.62% |
| 270 | Mendota | 6,994 | 41 | 0.59% |
| 271 | Chillicothe | 5,900 | 34 | 0.58% |
| 272 | Hoopeston | 5,034 | 29 | 0.58% |
| 273 | Morris | 14,898 | 84 | 0.56% |
| 274 | Hillside | 8,084 | 45 | 0.56% |
| 275 | Spring Valley | 5,476 | 30 | 0.55% |
| 276 | Jerseyville | 7,445 | 40 | 0.54% |
| 277 | Kewanee | 11,913 | 63 | 0.53% |
| 278 | Calumet Park | 6,855 | 35 | 0.51% |
| 279 | Palos Heights | 12,152 | 58 | 0.48% |
| 280 | Carlinville | 5,480 | 24 | 0.44% |
| 281 | Cicero | 82,797 | 350 | 0.42% |
| 282 | Hillsboro | 5,803 | 24 | 0.41% |
| 283 | Markham | 11,355 | 46 | 0.41% |
| 284 | Glenwood | 8,603 | 34 | 0.4% |
| 285 | Richton Park | 12,521 | 47 | 0.38% |
| 286 | Herrin | 12,226 | 45 | 0.37% |
| 287 | Park Forest | 21,156 | 73 | 0.35% |
| 288 | Country Club Hills | 16,324 | 56 | 0.34% |
| 289 | Chicago Heights | 26,736 | 87 | 0.33% |
| 290 | Metropolis | 5,864 | 18 | 0.31% |
| 291 | Bradley | 15,325 | 46 | 0.3% |
| 292 | Lynwood | 9,083 | 26 | 0.29% |
| 293 | Coal City | 5,317 | 15 | 0.28% |
| 294 | Hazel Crest | 13,792 | 37 | 0.27% |
| 295 | Eureka | 5,007 | 12 | 0.24% |
| 296 | Clinton | 6,985 | 16 | 0.23% |
| 297 | Dolton | 20,825 | 46 | 0.22% |
| 298 | Robinson | 7,084 | 15 | 0.21% |
| 299 | Mattoon | 16,586 | 32 | 0.19% |
| 300 | Vandalia | 5,796 | 11 | 0.19% |
| 301 | Calumet City | 35,100 | 56 | 0.16% |
| 302 | Litchfield | 6,834 | 10 | 0.15% |
| 303 | Riverdale | 10,340 | 15 | 0.15% |
| 304 | West Frankfort | 7,118 | 10 | 0.14% |
| 305 | Columbia | 11,127 | 13 | 0.12% |
| 306 | Canton | 13,144 | 15 | 0.11% |
| 307 | Manhattan | 11,026 | 12 | 0.11% |
| 308 | Harrisburg | 8,372 | 9 | 0.11% |
| 309 | Manteno | 9,030 | 8 | 0.09% |
| 310 | University Park | 7,306 | 6 | 0.08% |
| 311 | Paris | 8,276 | 6 | 0.07% |
| 312 | Rock Falls | 8,587 | 5 | 0.06% |
| 313 | Marengo | 7,040 | 4 | 0.06% |
| 314 | Wood River | 10,279 | 2 | 0.02% |
| 315 | East Alton | 5,689 | 0 | 0.0% |
| 316 | Sauk Village | 9,678 | 0 | 0.0% |
| 317 | Chester | 6,797 | 0 | 0.0% |
| 318 | Braidwood | 6,062 | 0 | 0.0% |
| 319 | Winthrop Harbor | 6,559 | 0 | 0.0% |
| 320 | Harvard | 9,598 | 0 | 0.0% |
| 321 | Pontoon Beach | 6,025 | 0 | 0.0% |
| 322 | Posen | 5,292 | 0 | 0.0% |
| 323 | Murphysboro | 6,735 | 0 | 0.0% |
| 324 | Du Quoin | 5,726 | 0 | 0.0% |