Most Asian cities in Tennessee research summary. We analyzed Tennessee’s most recent Census data to determine the most Asian cities in Tennessee based on the percentage of Asian residents.
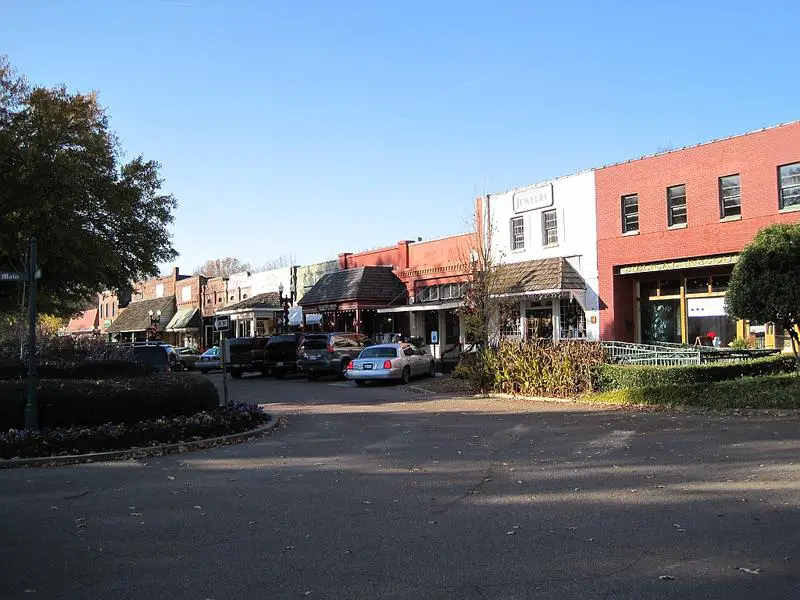
13.8% Asian · #1 most Asian in Tennessee
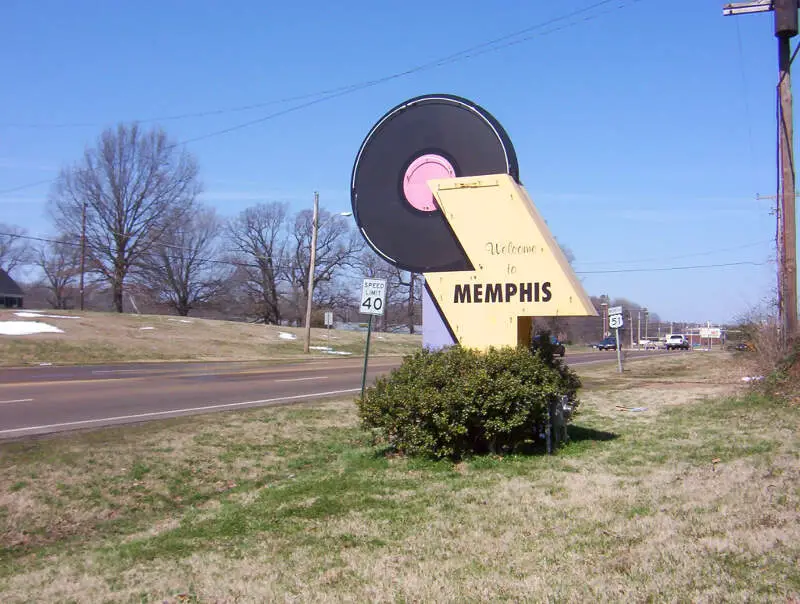
Collierville is a town in Shelby County, Tennessee, United States, and a suburb located in the Memphis metropolitan area. The town had a population of 43,965 at the 2010 census.
Data | Crime | Cost of living | Movers
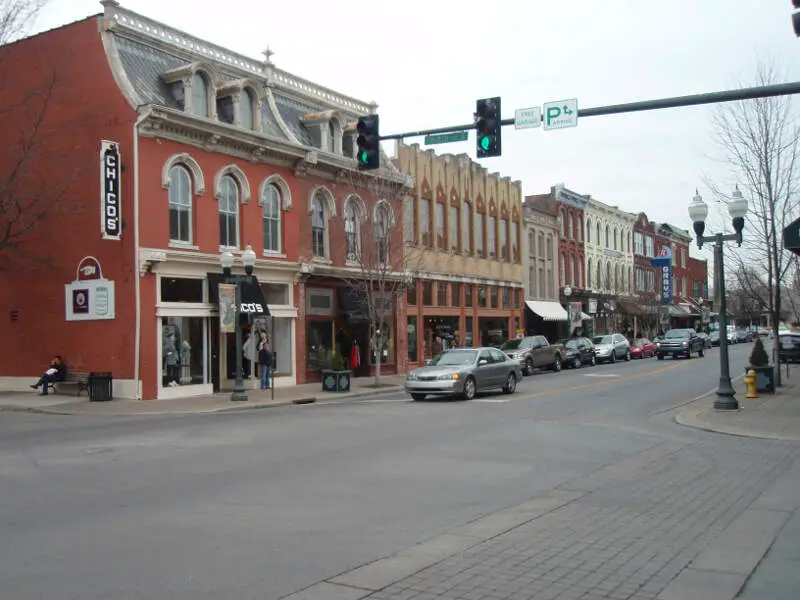
8.2% Asian · #2 most Asian in Tennessee
Franklin is a city in, and the county seat of, Williamson County, Tennessee, United States. Located about 21 miles south of Nashville, it is one of the principal cities of the Nashville metropolitan area. Since 1980, its population has increased more than fivefold and, based on its 2013 estimated population of 68,886, it is ranked as the seventh-largest city in Tennessee.
Data | Crime | Cost of living | Movers
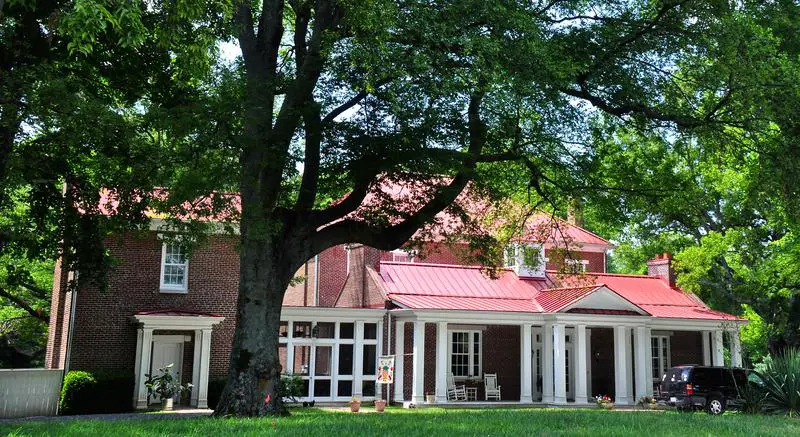
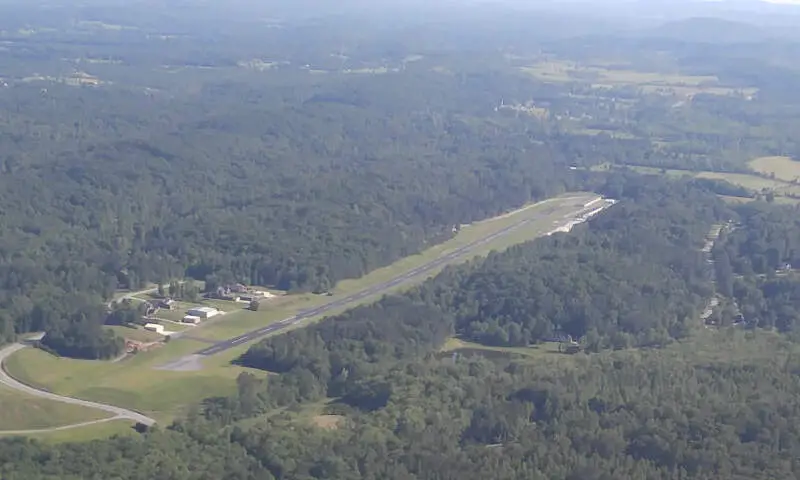
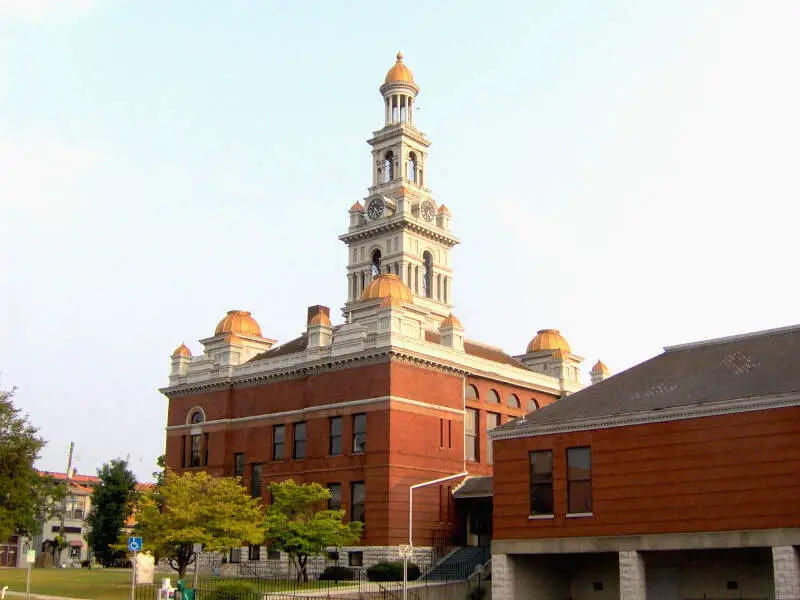
8.0% Asian · #3 most Asian in Tennessee
Brentwood is a suburb of Nashville, Tennessee; located in Williamson County, it is known for its rolling hills as well as being one of the wealthiest cities in America relative to average cost of living. The population was 37,060 as of the 2010 U.S. Census, and estimated at 40,982 in 2014.
Data | Crime | Cost of living | Movers
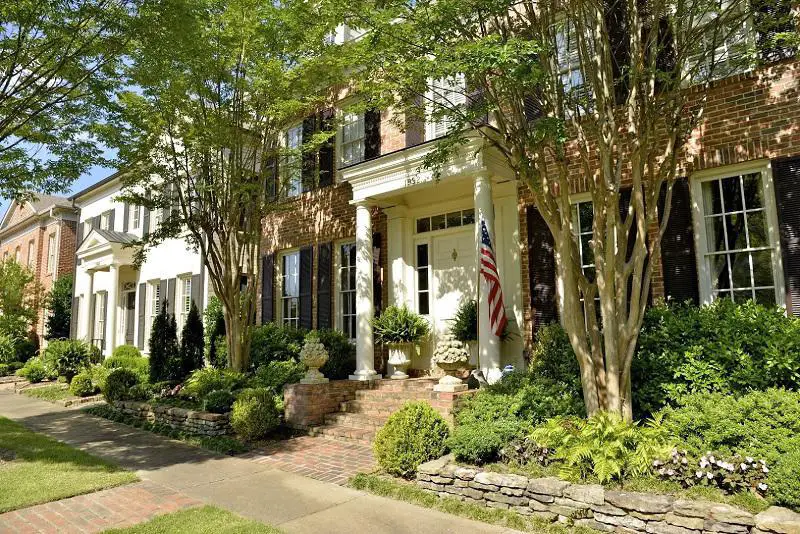
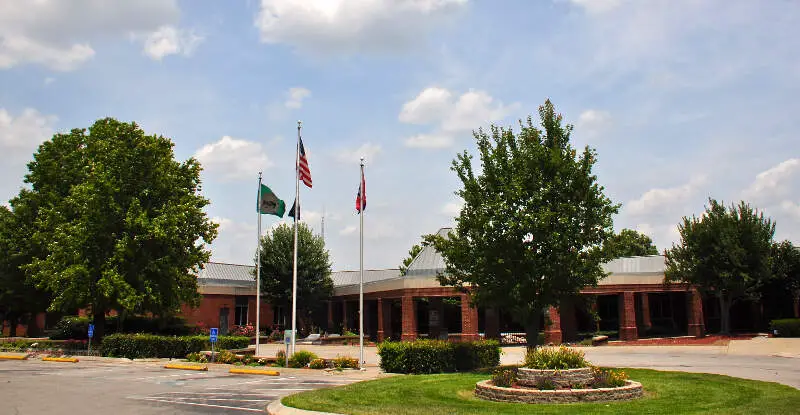
6.3% Asian · #4 most Asian in Tennessee
Germantown is a city in Shelby County, Tennessee, United States. The population was 38,844 at the 2010 census.
Data | Crime | Cost of living | Movers
6.0% Asian · #5 most Asian in Tennessee
Lakeland is a city in Shelby County, Tennessee, and a suburb of Memphis. The population was 12,430 at the 2010 census.
Data | Crime | Cost of living | Movers
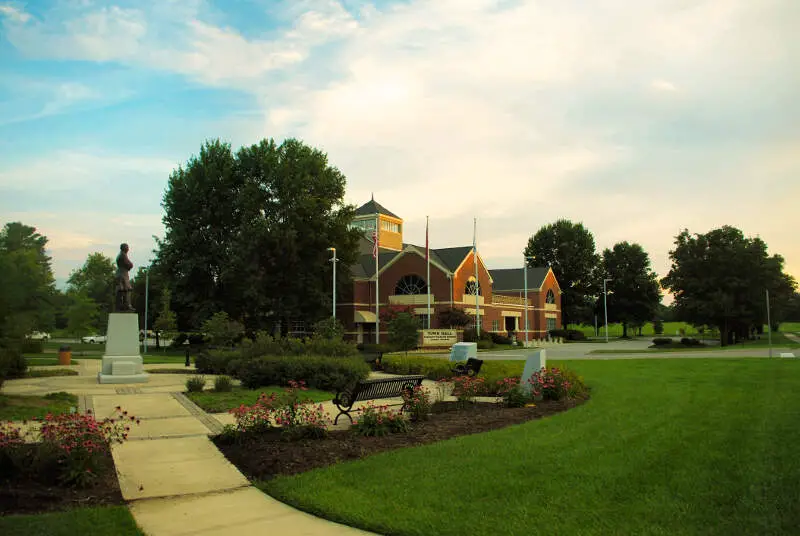
5.2% Asian · #6 most Asian in Tennessee
Collegedale is a city in Hamilton County, Tennessee, United States. The population was 8,282 at the 2010 census and 10,729 in a 2014 estimate. Collegedale is a suburb of Chattanooga and is part of the Chattanooga, TN-GA Metropolitan Statistical Area. Collegedale is home to Southern Adventist University. The median household income is among one of the highest in Hamilton County. It has been ranked as one of the best and safest places to live in Tennessee.
Data | Crime | Cost of living | Movers
5.1% Asian · #7 most Asian in Tennessee
Smyrna is a town in Rutherford County, Tennessee. Smyrna’s population was 39,974 at the 2010 census and 43,063 in 2013. In 2007, U.S. News & World Report listed Smyrna as one of the best places in the United States to retire.
Data | Crime | Cost of living | Movers

4.9% Asian · #8 most Asian in Tennessee
Mt. Juliet is a city located in western Wilson County, Tennessee. A suburb of Nashville, it is approximately 17 miles east of downtown Nashville. Mt. Juliet is located mostly between two major national east-west routes, Interstate 40 and U.S. Route 70. As of the 2015 special census, the city has a total population of 28,156. Mt. Juliet is the largest city in Wilson County. The official city charter has the name listed as Mt. Juliet, however the United States Postal Service lists the name as Mount Juliet.
Data | Crime | Cost of living | Movers
4.5% Asian · #9 most Asian in Tennessee
Farragut is a town which straddles both Knox and Loudon counties in Tennessee and is a suburb of Knoxville. The town’s population was 20,676 at the 2010 census. It is included in the Knoxville Metropolitan Area. The town is named in honor of American Civil War Admiral David Farragut, who was born just east of Farragut at Campbell’s Station in 1801.
Data | Crime | Cost of living | Movers
4.2% Asian · #10 most Asian in Tennessee
Sevierville is a city in and the county seat of Sevier County, Tennessee, located in Eastern Tennessee. The population was 14,807 at the 2010 United States Census and 16,355 according to the 2014 census estimate.
Data | Crime | Cost of living | Movers
The receipts
Compare the top ten
Pick a metric. The bars rescale. The red line is Tennessee’s statewide median.
On the map
Where Tennessee’s Asian communities live
Saturday Night Science
Methodology: How We Determined The Cities In Tennessee With The Largest Asian Population For 2026
We used Saturday Night Science to compare Census data on race across every place in Tennessee.
The Census’s most recently available data comes from the 2020-2024 American Community Survey.
Specifically, we looked at table B03002: Hispanic OR LATINO ORIGIN BY RACE. Here are the category names as defined by the Census:
- Hispanic or Latino
- White alone*
- Black or African American alone*
- American Indian and Alaska Native alone*
- Asian alone*
- Native Hawaiian and Other Pacific Islander alone*
- Some other race alone*
- Two or more races*
Our particular column of interest here was the number of people who identified as Asian alone.
We limited our analysis to cities with a population greater than 5,000 people. That left us with 92 cities.
We then calculated the percentage of residents that are Asian. The percentages ranked from 13.8% to 0.0%.
Finally, we ranked each city based on the percentage of Asian population, with a higher percentage being more Asian. Collierville took the distinction of being the most Asian, while Covington was the least Asian city.
We updated this article for 2026. This report reflects our eleventh time ranking the cities in Tennessee with the largest Asian population.
The full plate
Cities In Tennessee By Asian Population
Click any column to sort. Search by city name.
| Rank | City | Population | Asian Population | % Asian |
|---|---|---|---|---|
| 1 | Collierville | 51,515 | 7,092 | 13.8% |
| 2 | Franklin | 87,133 | 7,133 | 8.2% |
| 3 | Brentwood | 45,556 | 3,660 | 8.0% |
| 4 | Germantown | 40,673 | 2,556 | 6.3% |
| 5 | Lakeland | 14,192 | 845 | 6.0% |
| 6 | Collegedale | 11,330 | 584 | 5.2% |
| 7 | Smyrna | 56,692 | 2,894 | 5.1% |
| 8 | Mount Juliet | 42,073 | 2,056 | 4.9% |
| 9 | Farragut | 24,634 | 1,115 | 4.5% |
| 10 | Sevierville | 18,397 | 771 | 4.2% |
| 11 | La Vergne | 40,243 | 1,648 | 4.1% |
| 12 | Bartlett | 56,876 | 2,191 | 3.9% |
| 13 | Nolensville | 15,074 | 561 | 3.7% |
| 14 | Murfreesboro | 161,445 | 5,982 | 3.7% |
| 15 | Millington | 11,289 | 360 | 3.2% |
| 16 | Martin | 10,915 | 341 | 3.1% |
| 17 | Manchester | 12,944 | 362 | 2.8% |
| 18 | Arlington | 15,205 | 412 | 2.7% |
| 19 | Oak Ridge | 32,693 | 854 | 2.6% |
| 20 | Clarksville | 176,456 | 4,410 | 2.5% |
| 21 | Chattanooga | 185,783 | 4,187 | 2.3% |
| 22 | Cleveland | 48,829 | 1,100 | 2.3% |
| 23 | Hendersonville | 63,091 | 1,389 | 2.2% |
| 24 | Spring Hill | 55,765 | 1,218 | 2.2% |
| 25 | Johnson City | 72,222 | 1,442 | 2.0% |
| 26 | Newport | 6,881 | 136 | 2.0% |
| 27 | Lebanon | 44,788 | 885 | 2.0% |
| 28 | Gallatin | 48,532 | 950 | 2.0% |
| 29 | Cookeville | 36,088 | 695 | 1.9% |
| 30 | McKenzie | 5,631 | 107 | 1.9% |
| 31 | Maryville | 32,392 | 608 | 1.9% |
| 32 | Winchester | 9,799 | 172 | 1.8% |
| 33 | Red Bank | 12,010 | 209 | 1.7% |
| 34 | Memphis | 618,980 | 10,442 | 1.7% |
| 35 | Kingston | 6,224 | 104 | 1.7% |
| 36 | Munford | 6,588 | 105 | 1.6% |
| 37 | Knoxville | 195,185 | 3,088 | 1.6% |
| 38 | Millersville | 5,836 | 85 | 1.5% |
| 39 | East Ridge | 22,070 | 320 | 1.4% |
| 40 | Pigeon Forge | 6,375 | 91 | 1.4% |
| 41 | Lenoir City | 11,110 | 158 | 1.4% |
| 42 | Goodlettsville | 17,597 | 249 | 1.4% |
| 43 | Atoka | 10,385 | 145 | 1.4% |
| 44 | Jackson | 68,435 | 881 | 1.3% |
| 45 | Alcoa | 12,222 | 156 | 1.3% |
| 46 | Athens | 14,471 | 176 | 1.2% |
| 47 | Signal Mountain | 8,860 | 104 | 1.2% |
| 48 | Columbia | 45,441 | 500 | 1.1% |
| 49 | McMinnville | 13,844 | 143 | 1.0% |
| 50 | Kingsport | 56,262 | 575 | 1.0% |
| 51 | White House | 14,631 | 149 | 1.0% |
| 52 | Dayton | 7,625 | 73 | 1.0% |
| 53 | Tullahoma | 21,103 | 173 | 0.8% |
| 54 | Springfield | 19,255 | 156 | 0.8% |
| 55 | Morristown | 31,527 | 233 | 0.7% |
| 56 | Dyersburg | 15,979 | 102 | 0.6% |
| 57 | Shelbyville | 24,661 | 138 | 0.6% |
| 58 | Jefferson City | 8,579 | 45 | 0.5% |
| 59 | Clinton | 10,239 | 52 | 0.5% |
| 60 | Lexington | 7,962 | 38 | 0.5% |
| 61 | Milan | 8,244 | 38 | 0.5% |
| 62 | Henderson | 6,411 | 29 | 0.5% |
| 63 | Elizabethton | 14,374 | 63 | 0.4% |
| 64 | Greeneville | 15,646 | 68 | 0.4% |
| 65 | Paris | 10,338 | 44 | 0.4% |
| 66 | Lewisburg | 12,861 | 54 | 0.4% |
| 67 | Bristol | 27,636 | 91 | 0.3% |
| 68 | Mount Carmel | 5,472 | 16 | 0.3% |
| 69 | Union City | 10,982 | 27 | 0.2% |
| 70 | Dickson | 16,424 | 40 | 0.2% |
| 71 | La Follette | 7,273 | 17 | 0.2% |
| 72 | Oakland | 9,979 | 23 | 0.2% |
| 73 | Portland | 13,449 | 30 | 0.2% |
| 74 | Greenbrier | 6,971 | 13 | 0.2% |
| 75 | Pulaski | 8,285 | 13 | 0.2% |
| 76 | Ripley | 7,658 | 11 | 0.1% |
| 77 | Rockwood | 5,566 | 6 | 0.1% |
| 78 | Harriman | 6,090 | 5 | 0.1% |
| 79 | Hartsville/Trousdale County | 11,957 | 9 | 0.1% |
| 80 | Fairview | 10,009 | 7 | 0.1% |
| 81 | Crossville | 12,428 | 8 | 0.1% |
| 82 | Church Hill | 7,139 | 4 | 0.1% |
| 83 | Savannah | 7,412 | 1 | 0.0% |
| 84 | Humboldt | 7,787 | 1 | 0.0% |
| 88 | Erwin | 5,988 | 0 | 0.0% |
| 88 | Fayetteville | 7,057 | 0 | 0.0% |
| 88 | Bolivar | 5,144 | 0 | 0.0% |
| 88 | Soddy-Daisy | 13,231 | 0 | 0.0% |
| 88 | Brownsville | 9,622 | 0 | 0.0% |
| 88 | Sweetwater | 6,532 | 0 | 0.0% |
| 88 | Lawrenceburg | 11,844 | 0 | 0.0% |
| 88 | Covington | 8,587 | 0 | 0.0% |
Source: U.S. Census ACS 2020-2024. 92 cities with more than 5,000 residents.
Summary
Summary: Asian Populations Across Tennessee
If you’re looking for a breakdown of Asian populations across Tennessee according to the most recent data, this is an accurate list.
The most Asian cities in Tennessee are Collierville, Franklin, Brentwood, Germantown, Lakeland, Collegedale, Smyrna, Mount Juliet, Farragut, and Sevierville.


