
Before you decide to relocate to Kansas, it’s important to research the exact cost of living around the state. And that’s what we’re going to help you do.
These are the places in Kansas that cost a pretty penny — the most expensive cities in the state.
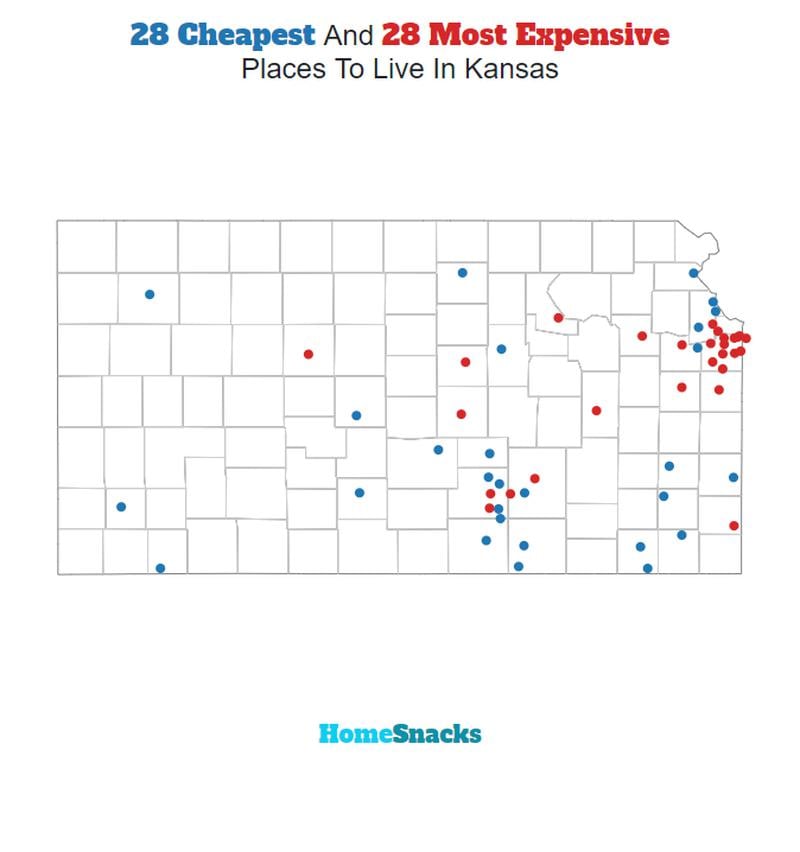
We used Saturday Night Science to compare the 2020-2024 American Community Survey on cost of living for the 64 places in Kansas with more than 5,000 people.
After we saved up for months and could finally afford it, we landed on this list of the ten most expensive cities in Kansas for 2026.
Table Of Contents: Top Ten | Methodology | Summary | Table
The 10 Most Expensive Places To Live In Kansas For 2026
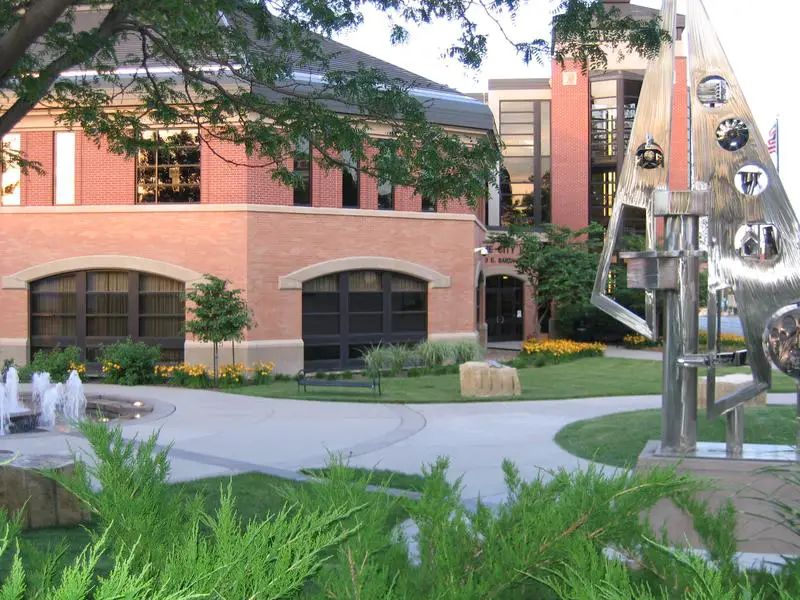
What’s the most expensive place to live in Kansas? Well, HomeSnacks crunched the numbers and discovered that Leawood is the most expensive place to live in Kansas.
Chanute (the cheapest place to live in Kansas) can show these guys how to live on a budget in the coming years. Read on for how these places had costs rise faster than inflation.
And if you already knew these places were expensive, check out some more reading about Kansas and the most expensive cities in the country:
The 10 Most Expensive Places To Live In Kansas For 2026

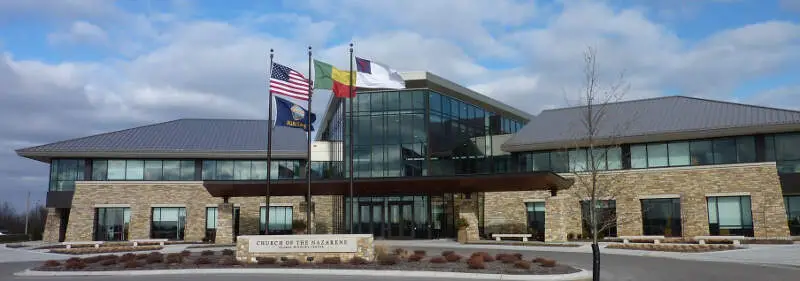
/10
Population: 33,809
Cost Of Living Index: 134
Median Income: $185,625
Average Home Price: $777,578
Home Price To Income Ratio: 4.2x
More on Leawood: Data | Crime | Cost Of Living | Movers
The overall cost of living in Leawood is 134. The median income in Leawood comes in at $185,625 and the average home value is $777,578 for 2026.
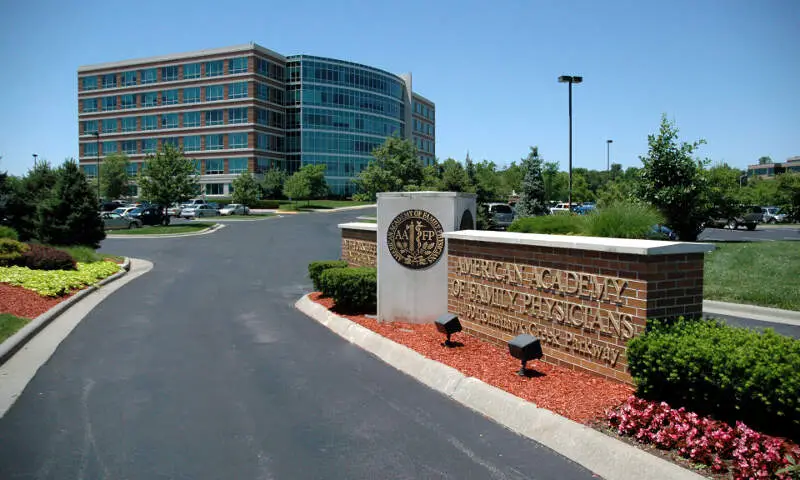
/10
Population: 22,874
Cost Of Living Index: 117
Median Income: $113,530
Average Home Price: $488,596
Home Price To Income Ratio: 4.3x
More on Prairie Village: Data | Crime | Cost Of Living | Movers
The overall cost of living in Prairie Village is 117. The median income in Prairie Village comes in at $113,530 and the average home value is $488,596 for 2026.

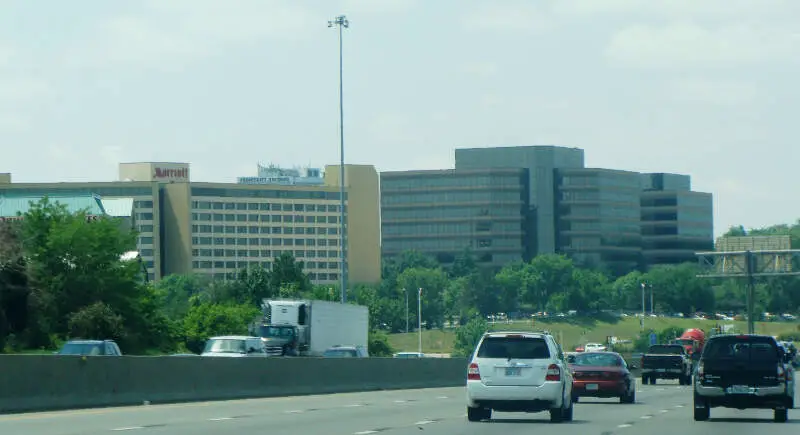
/10
Population: 200,306
Cost Of Living Index: 112
Median Income: $104,834
Average Home Price: $482,294
Home Price To Income Ratio: 4.6x
More on Overland Park: Data | Crime | Cost Of Living | Movers
The overall cost of living in Overland Park is 112. The median income in Overland Park comes in at $104,834 and the average home value is $482,294 for 2026.

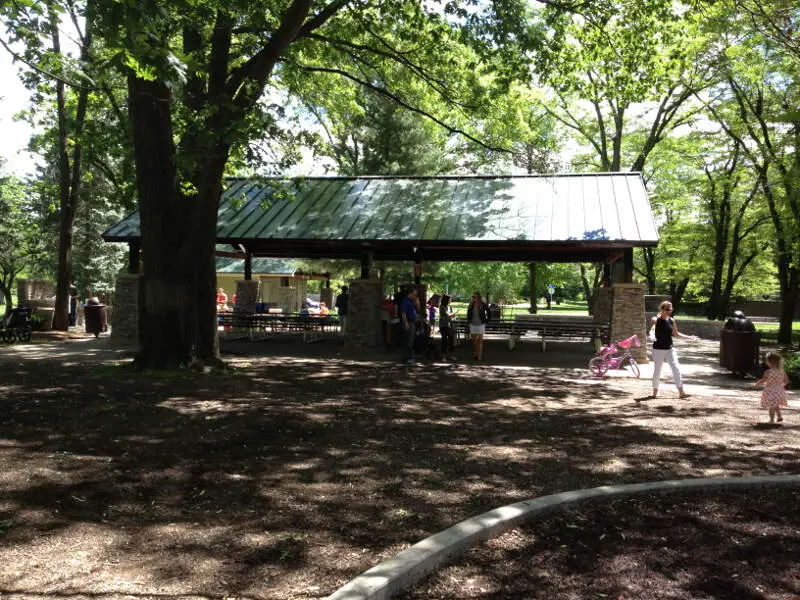
/10
Population: 58,384
Cost Of Living Index: 110
Median Income: $103,239
Average Home Price: $477,847
Home Price To Income Ratio: 4.6x
More on Lenexa: Data | Crime | Cost Of Living | Movers
The overall cost of living in Lenexa is 110. The median income in Lenexa comes in at $103,239 and the average home value is $477,847 for 2026.

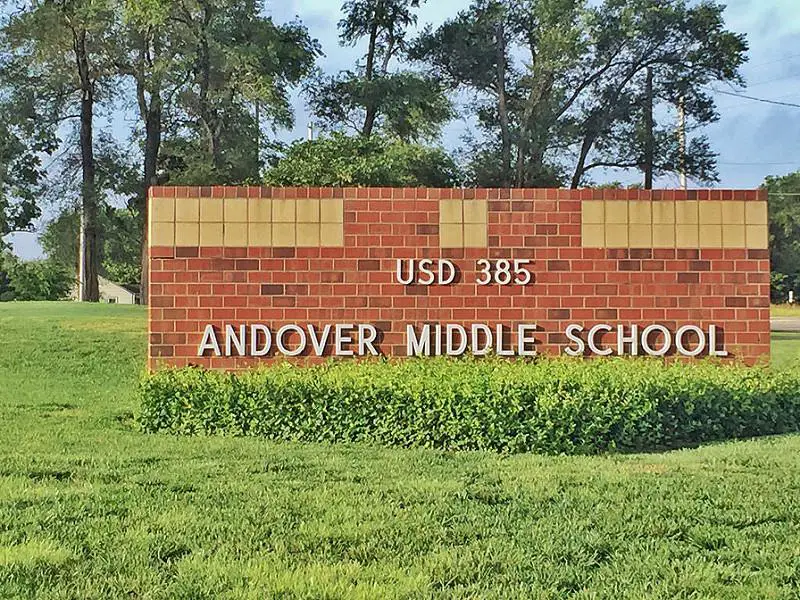
/10
Population: 15,965
Cost Of Living Index: 108
Median Income: $104,787
Average Home Price: $325,994
Home Price To Income Ratio: 3.1x
More on Andover: Data | Crime | Cost Of Living | Movers
The overall cost of living in Andover is 108. The median income in Andover comes in at $104,787 and the average home value is $325,994 for 2026.

/10
Population: 145,057
Cost Of Living Index: 107
Median Income: $114,009
Average Home Price: $433,116
Home Price To Income Ratio: 3.8x
More on Olathe: Data | Crime | Cost Of Living | Movers
The overall cost of living in Olathe is 107. The median income in Olathe comes in at $114,009 and the average home value is $433,116 for 2026.


/10
Population: 68,542
Cost Of Living Index: 106
Median Income: $109,940
Average Home Price: $424,763
Home Price To Income Ratio: 3.9x
More on Shawnee: Data | Crime | Cost Of Living | Movers
The overall cost of living in Shawnee is 106. The median income in Shawnee comes in at $109,940 and the average home value is $424,763 for 2026.
/10
Population: 7,491
Cost Of Living Index: 106
Median Income: $116,769
Average Home Price: $439,342
Home Price To Income Ratio: 3.8x
More on Basehor: Data | Crime | Cost Of Living | Movers
The overall cost of living in Basehor is 106. The median income in Basehor comes in at $116,769 and the average home value is $439,342 for 2026.

/10
Population: 9,120
Cost Of Living Index: 104
Median Income: $112,428
Average Home Price: $419,142
Home Price To Income Ratio: 3.7x
More on Spring Hill: Data | Crime | Cost Of Living | Movers
The overall cost of living in Spring Hill is 104. The median income in Spring Hill comes in at $112,428 and the average home value is $419,142 for 2026.

/10
Population: 6,763
Cost Of Living Index: 103
Median Income: $88,774
Average Home Price: $332,319
Home Price To Income Ratio: 3.7x
More on Roeland Park: Data | Crime | Cost Of Living | Movers
The overall cost of living in Roeland Park is 103. The median income in Roeland Park comes in at $88,774 and the average home value is $332,319 for 2026.
Methodology: How We Determined The Most Expensive Places To Live In The Sunflower State For 2026
The two most important things to think about when it comes to being able to afford a city in Kansas are:
- How much money do I make?
- How much do I have to spend to live there?
You need to understand your costs in the context of how much money you make.
For example, if the median household earns $100,000 and spends $40,000 on housing, it’s actually cheaper to live there than a place with a median income of $50,000 and housing costs of $21,000. You might spend more on housing, but you have more money overall to play with.
With that example in mind, we derived several statistics from the latest Census American Community Survey 2020-2024 around incomes and costs. They are:
- Overall Cost Of Living Index
- Median Home Price / Median Income (lower is better)
- Median Income / Median Rent (Higher is better)
- Median Home Price
You can then compare these metrics in each of the places in Kansas to figure out which is the most expensive.
You are left with a “Cost of Living Index” by taking the average rank of each of these metrics for each city.
So we used that cost of living index to rank all of the 64 places in Kansas that have more than 5,000 people.
The place with the highest cost of living in Kansas according to the data is Leawood. We updated this article for 2026. This article is our eleventh time ranking the most expensive places to live in Kansas.
Summary: Taking A Chunk Out Of Your Paycheck In Kansas For 2026
Well, there you have it, the places in Kansas that have the highest cost of living, with Leawood ranking as the most expensive city in the Sunflower State.
The most expensive cities in Kansas are Leawood, Prairie Village, Overland Park, Lenexa, Andover, Olathe, Shawnee, Basehor, Spring Hill, and Roeland Park.
Here’s a look at the most affordable cities in Kansas according to the data:
- Chanute
- Parsons
- Fort Scott
For more Kansas reading, check out:
- Best Places To Live In Kansas
- Cheapest Places To Live In Kansas
- Most Dangerous Places In Kansas
- Safest Places In Kansas
- Worst Places To Live In Kansas
Most Expensive Cities In Kansas
| Rank | City | Cost Of Living | Population | Median Income | Average Home Price | Home/Income Ratio |
|---|---|---|---|---|---|---|
| 1 | Leawood | 134 | 33,809 | $185,625 | $777,578 | 4.2x |
| 2 | Prairie Village | 117 | 22,874 | $113,530 | $488,596 | 4.3x |
| 3 | Overland Park | 112 | 200,306 | $104,834 | $482,294 | 4.6x |
| 4 | Lenexa | 110 | 58,384 | $103,239 | $477,847 | 4.6x |
| 5 | Andover | 108 | 15,965 | $104,787 | $325,994 | 3.1x |
| 6 | Olathe | 107 | 145,057 | $114,009 | $433,116 | 3.8x |
| 7 | Shawnee | 106 | 68,542 | $109,940 | $424,763 | 3.9x |
| 8 | Basehor | 106 | 7,491 | $116,769 | $439,342 | 3.8x |
| 9 | Spring Hill | 104 | 9,120 | $112,428 | $419,142 | 3.7x |
| 10 | Roeland Park | 103 | 6,763 | $88,774 | $332,319 | 3.7x |
| 11 | De Soto | 103 | 6,414 | $104,000 | $425,983 | 4.1x |
| 12 | Louisburg | 101 | 5,094 | $68,824 | $400,546 | 5.8x |
| 13 | Manhattan | 100 | 54,239 | $60,172 | $288,517 | 4.8x |
| 14 | Lansing | 100 | 11,246 | $102,786 | $321,293 | 3.1x |
| 15 | Gardner | 99 | 24,526 | $96,818 | $352,182 | 3.6x |
| 16 | Eudora | 99 | 6,119 | $118,184 | $332,797 | 2.8x |
| 17 | Lawrence | 98 | 96,051 | $65,009 | $331,112 | 5.1x |
| 18 | Merriam | 98 | 11,085 | $73,600 | $326,708 | 4.4x |
| 19 | Mission | 98 | 9,915 | $75,534 | $330,950 | 4.4x |
| 20 | Bel Aire | 98 | 9,043 | $97,795 | $278,865 | 2.9x |
| 21 | Bonner Springs | 97 | 7,839 | $83,218 | $300,304 | 3.6x |
| 22 | Derby | 96 | 26,062 | $84,112 | $282,214 | 3.4x |
| 23 | Valley Center | 96 | 8,590 | $77,020 | $260,221 | 3.4x |
| 24 | Garden City | 95 | 27,819 | $72,865 | $233,702 | 3.2x |
| 25 | Hays | 94 | 21,143 | $58,459 | $252,837 | 4.3x |
| 26 | Maize | 94 | 6,824 | $72,024 | $307,837 | 4.3x |
| 27 | Goddard | 94 | 6,030 | $94,004 | $300,789 | 3.2x |
| 28 | Tonganoxie | 94 | 5,891 | $80,109 | $373,875 | 4.7x |
| 29 | Paola | 94 | 5,770 | $74,662 | $371,665 | 5.0x |
| 30 | Leavenworth | 93 | 37,195 | $72,987 | $260,124 | 3.6x |
| 31 | Wichita | 92 | 397,945 | $64,620 | $202,719 | 3.1x |
| 32 | Junction City | 92 | 22,331 | $61,181 | $207,588 | 3.4x |
| 33 | Park City | 92 | 7,673 | $74,301 | $220,147 | 3.0x |
| 34 | Salina | 91 | 46,307 | $61,783 | $173,120 | 2.8x |
| 35 | Liberal | 91 | 19,316 | $63,706 | $145,107 | 2.3x |
| 36 | McPherson | 90 | 13,995 | $77,529 | $217,268 | 2.8x |
| 37 | Ulysses | 90 | 5,476 | $63,857 | $153,433 | 2.4x |
| 38 | Abilene | 89 | 6,449 | $57,924 | $184,104 | 3.2x |
| 39 | Colby | 89 | 5,387 | $63,494 | $180,597 | 2.8x |
| 40 | Dodge City | 88 | 27,613 | $68,721 | $210,131 | 3.1x |
| 41 | Newton | 88 | 18,397 | $68,885 | $171,182 | 2.5x |
| 42 | Ottawa | 88 | 12,678 | $71,699 | $235,345 | 3.3x |
| 43 | Augusta | 88 | 9,216 | $64,919 | $214,257 | 3.3x |
| 44 | Hutchinson | 87 | 39,709 | $58,687 | $146,980 | 2.5x |
| 45 | Great Bend | 87 | 14,479 | $54,139 | $124,918 | 2.3x |
| 46 | Mulvane | 87 | 6,171 | $74,039 | $235,790 | 3.2x |
| 47 | Kansas City | 86 | 155,135 | $62,401 | $198,194 | 3.2x |
| 48 | Topeka | 86 | 125,786 | $56,956 | $190,096 | 3.3x |
| 49 | Winfield | 86 | 11,711 | $56,656 | $137,701 | 2.4x |
| 50 | Haysville | 86 | 11,117 | $67,740 | $207,754 | 3.1x |
| 51 | Pratt | 86 | 6,577 | $63,819 | $123,110 | 1.9x |
| 52 | El Dorado | 85 | 12,769 | $59,180 | $169,660 | 2.9x |
| 53 | Concordia | 85 | 5,015 | $51,138 | $125,723 | 2.5x |
| 54 | Emporia | 84 | 24,131 | $52,704 | $169,150 | 3.2x |
| 55 | Atchison | 84 | 10,785 | $54,474 | $166,545 | 3.1x |
| 56 | Independence | 83 | 8,422 | $51,069 | $114,893 | 2.2x |
| 57 | Wellington | 83 | 7,615 | $50,333 | $110,050 | 2.2x |
| 58 | Iola | 83 | 5,348 | $54,221 | $87,714 | 1.6x |
| 59 | Pittsburg | 82 | 20,637 | $43,419 | $133,321 | 3.1x |
| 60 | Arkansas City | 82 | 11,884 | $49,629 | $97,615 | 2.0x |
| 61 | Coffeyville | 80 | 8,662 | $45,670 | $62,588 | 1.4x |
| 62 | Fort Scott | 80 | 7,555 | $52,159 | $127,119 | 2.4x |
| 63 | Parsons | 79 | 9,425 | $52,428 | $78,523 | 1.5x |
| 64 | Chanute | 79 | 8,598 | $50,882 | $96,749 | 1.9x |