Before you decide to relocate to Minnesota, it’s important to research the exact cost of living around the state. And that’s what we’re going to help you do.
These are the places in Minnesota that cost a pretty penny — the most expensive cities in the state.
We used Saturday Night Science to compare the 2020-2024 American Community Survey on cost of living for the 151 places in Minnesota with more than 5,000 people.
After we saved up for months and could finally afford it, we landed on this list of the ten most expensive cities in Minnesota for 2026.

$173,527 median income · $1,113,974 median home · #1 home prices in Minnesota
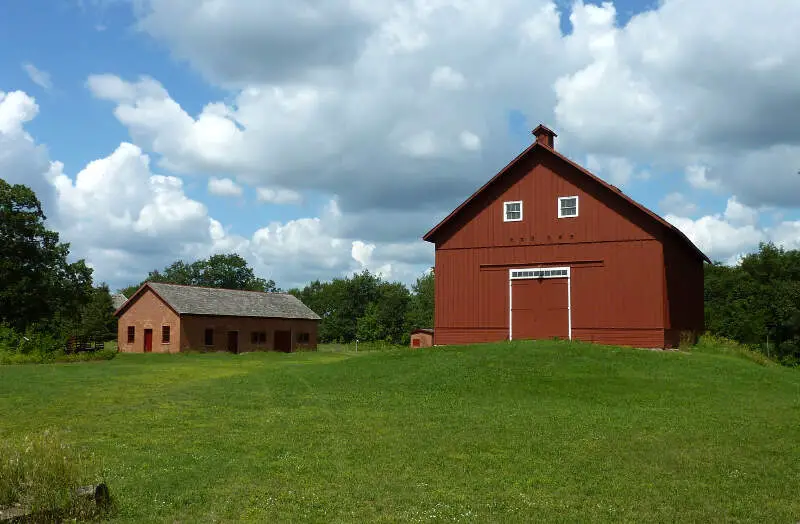
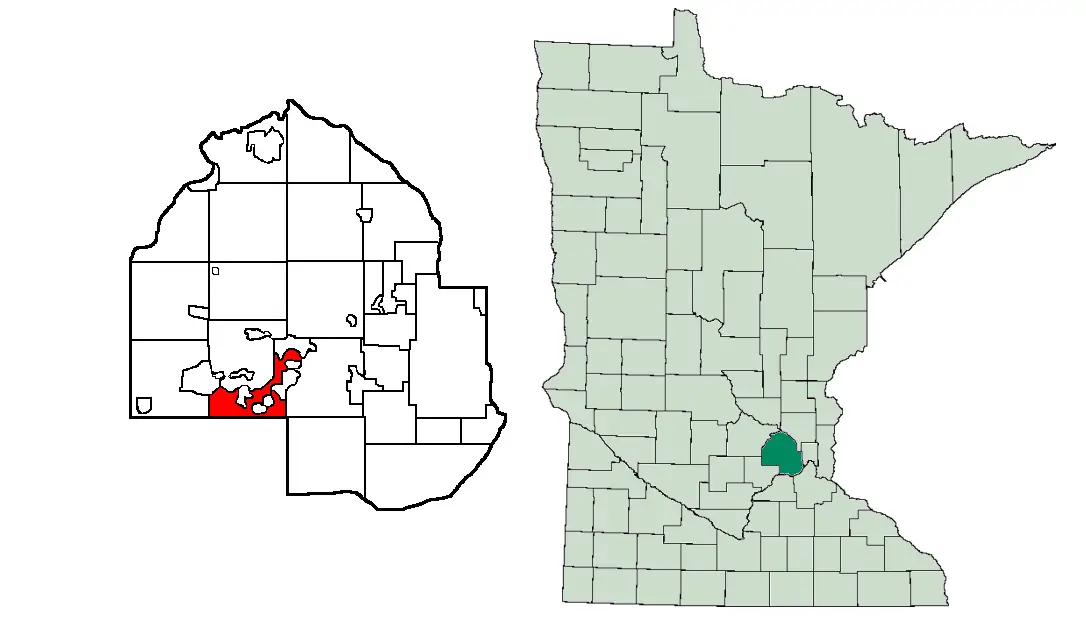
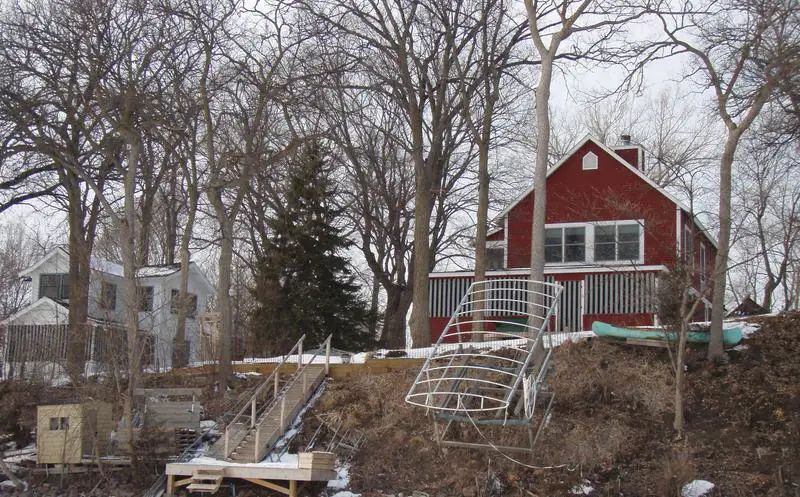
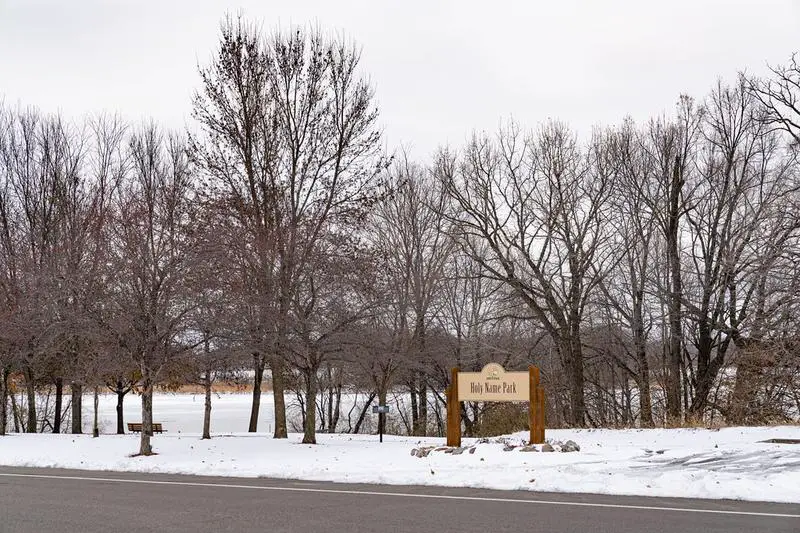
Orono is a city on the northern shores of Lake Minnetonka in Hennepin County, Minnesota, United States. The population was 7,437 at the 2010 census.
Data | Crime | Cost of living | Movers
$231,742 median income · $936,794 median home · #2 home prices in Minnesota
Data | Crime | Cost of living | Movers
$171,063 median income · $804,465 median home · #4 home prices in Minnesota
Data | Crime | Cost of living | Movers
$163,051 median income · $684,705 median home · #5 home prices in Minnesota
Data | Crime | Cost of living | Movers
$230,859 median income · $832,022 median home · #3 home prices in Minnesota
Data | Crime | Cost of living | Movers
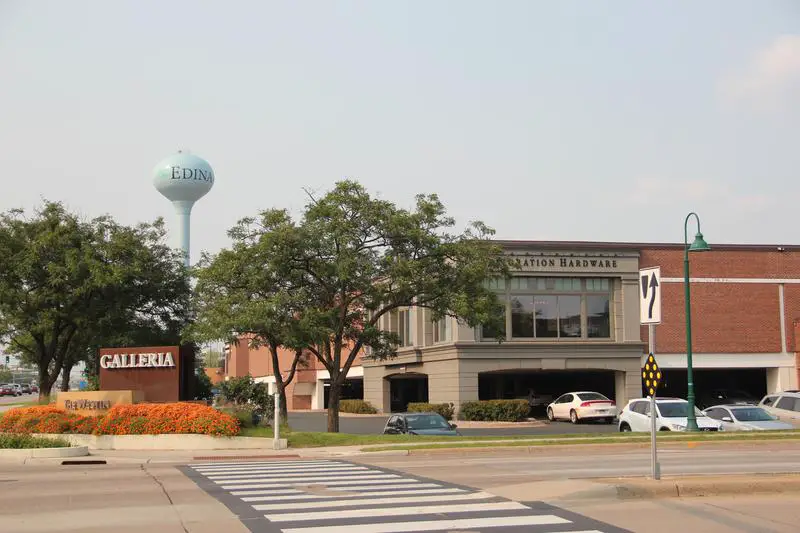
$128,767 median income · $615,641 median home · #7 home prices in Minnesota
Edina ee-DY-n), officially known as the City of Edina, is a city in Hennepin County, Minnesota, United States, and a suburb situated immediately southwest of Minneapolis. Edina began as a small farming and milling community in the 1860s. The population was 47,941, as of 2010.
Data | Crime | Cost of living | Movers
$195,639 median income · $608,561 median home · #8 home prices in Minnesota
Victoria is a city in Carver County, Minnesota, United States. The population was 7,345 at the 2010 census.
Data | Crime | Cost of living | Movers
$153,669 median income · $618,480 median home · #6 home prices in Minnesota
Lake Elmo is a city in Washington County, Minnesota, United States. The population was 8,069 at the 2010 census.
Data | Crime | Cost of living | Movers

$133,423 median income · $601,129 median home · #9 home prices in Minnesota
Corcoran is a city in Hennepin County, Minnesota, United States. The population was 5,379 at the 2010 census.
Data | Crime | Cost of living | Movers
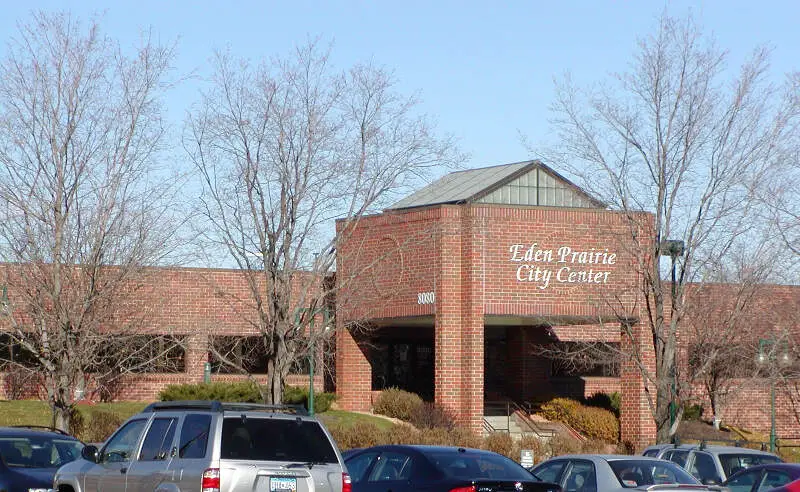
$130,489 median income · $501,363 median home · #15 home prices in Minnesota
Eden Prairie is an edge city 12 miles southwest of downtown Minneapolis in Hennepin County, and the 12th-largest city in the State of Minnesota. It is on the north bank of the Minnesota River, upstream from its confluence with the Mississippi River. Eden Prairie and nearby suburbs form the southwest portion of Minneapolis-Saint Paul, the 15th-largest metropolitan area in the United States, with about 3.6 million residents. Eden Prairie had a population of 60,797 at the 2010 census, which made it the 7th-largest suburb in the Twin Cities and the 12th-largest city in Minnesota.
Data | Crime | Cost of living | Movers
The receipts
Compare the top ten
Pick a metric. The bars rescale. The red line is Minnesota’s statewide median.
Minnesota statewide median: $346,668
Minnesota statewide median: $89,062
On the map
Mapping the most expensive places in Minnesota
Saturday Night Science
Methodology: How We Determined The Most Expensive Places To Live In The North Star State For 2026
The two most important things to think about when it comes to being able to afford a city in Minnesota are how much money you make and how much you have to spend to live there.
You need to understand your costs in the context of how much money you make.
For example, if the median household earns $100,000 and spends $40,000 on housing, it’s actually cheaper to live there than a place with a median income of $50,000 and housing costs of $21,000. You might spend more on housing, but you have more money overall to play with.
With that example in mind, we derived several statistics from the latest Census American Community Survey 2020-2024 around incomes and costs. They are:
- Overall Cost Of Living Index
- Median Home Price / Median Income (lower is better)
- Median Income / Median Rent (Higher is better)
- Median Home Price
You can then compare these metrics in each of the places in Minnesota to figure out which is the most expensive.
You are left with a “Cost of Living Index” by taking the average rank of each of these metrics for each city.
So we used that cost of living index to rank all of the 151 places in Minnesota that have more than 5,000 people.
The place with the highest cost of living in Minnesota according to the data is Orono. We updated this article for 2026. This article is our eleventh time ranking the most expensive places to live in Minnesota. The median Minnesota home is 47 years old — old enough that it pays to compare home warranty plans before something expensive breaks.
The full plate
Most Expensive Cities In Minnesota
Click any column to sort. Search by city name.
| Rank | City | Cost Of Living | Population | Median Income | Average Home Price | Home/Income Ratio |
|---|---|---|---|---|---|---|
| 1 | Orono | 174 | 8,195 | $173,527 | $1,113,974 | 6.4x |
| 2 | North Oaks | 173 | 5,179 | $231,742 | $936,794 | 4.0x |
| 3 | Shorewood | 148 | 7,647 | $171,063 | $804,465 | 4.7x |
| 4 | Minnetrista | 147 | 8,708 | $163,051 | $684,705 | 4.2x |
| 5 | Medina | 145 | 6,968 | $230,859 | $832,022 | 3.6x |
| 6 | Edina | 141 | 53,262 | $128,767 | $615,641 | 4.8x |
| 7 | Victoria | 133 | 11,295 | $195,639 | $608,561 | 3.1x |
| 8 | Lake Elmo | 132 | 13,140 | $153,669 | $618,480 | 4.0x |
| 9 | Corcoran | 131 | 7,302 | $133,423 | $601,129 | 4.5x |
| 10 | Eden Prairie | 128 | 63,051 | $130,489 | $501,363 | 3.8x |
| 11 | Chanhassen | 128 | 26,006 | $143,651 | $548,742 | 3.8x |
| 12 | Minnetonka | 127 | 53,064 | $119,517 | $483,591 | 4.0x |
| 13 | Mendota Heights | 126 | 11,612 | $132,768 | $562,137 | 4.2x |
| 14 | Mahtomedi | 126 | 8,133 | $123,319 | $478,624 | 3.9x |
| 15 | Plymouth | 124 | 79,220 | $136,534 | $508,713 | 3.7x |
| 16 | Rogers | 124 | 13,685 | $158,750 | $458,983 | 2.9x |
| 17 | Dayton | 123 | 9,095 | $148,947 | $509,219 | 3.4x |
| 18 | Lakeville | 122 | 74,354 | $139,041 | $487,882 | 3.5x |
| 19 | Andover | 122 | 33,035 | $137,593 | $435,598 | 3.2x |
| 20 | Golden Valley | 122 | 21,725 | $108,772 | $437,256 | 4.0x |
| 21 | Carver | 122 | 6,239 | $147,697 | $493,733 | 3.3x |
| 22 | Savage | 121 | 32,889 | $125,513 | $427,463 | 3.4x |
| 23 | Woodbury | 120 | 78,305 | $125,310 | $457,355 | 3.6x |
| 24 | Prior Lake | 120 | 28,016 | $134,255 | $525,577 | 3.9x |
| 25 | Oak Grove | 120 | 9,130 | $117,696 | $462,896 | 3.9x |
| 26 | Arden Hills | 118 | 9,658 | $134,118 | $477,166 | 3.6x |
| 27 | Maple Grove | 117 | 71,173 | $132,731 | $424,803 | 3.2x |
| 28 | Eagan | 117 | 68,000 | $108,690 | $401,217 | 3.7x |
| 29 | Rosemount | 117 | 27,562 | $129,625 | $432,777 | 3.3x |
| 30 | Ham Lake | 117 | 16,702 | $120,135 | $492,264 | 4.1x |
| 31 | Elko New Market | 117 | 5,002 | $152,150 | $472,662 | 3.1x |
| 32 | Minneapolis | 116 | 427,246 | $80,846 | $330,882 | 4.1x |
| 33 | St. Louis Park | 116 | 49,594 | $101,648 | $379,371 | 3.7x |
| 34 | Ramsey | 116 | 28,421 | $116,415 | $381,243 | 3.3x |
| 35 | Shoreview | 116 | 26,714 | $108,370 | $410,993 | 3.8x |
| 36 | Otsego | 116 | 22,245 | $119,927 | $418,193 | 3.5x |
| 37 | St. Anthony | 116 | 9,671 | $97,363 | $396,789 | 4.1x |
| 38 | Falcon Heights | 116 | 5,085 | $96,528 | $412,532 | 4.3x |
| 39 | Cottage Grove | 115 | 40,992 | $120,791 | $396,381 | 3.3x |
| 40 | Lino Lakes | 115 | 22,113 | $127,181 | $447,709 | 3.5x |
| 41 | Forest Lake | 115 | 20,729 | $92,944 | $421,551 | 4.5x |
| 42 | Hugo | 115 | 16,340 | $116,228 | $432,376 | 3.7x |
| 43 | Blaine | 114 | 72,488 | $106,801 | $378,017 | 3.5x |
| 44 | Burnsville | 114 | 64,463 | $87,024 | $368,611 | 4.2x |
| 45 | Apple Valley | 114 | 55,679 | $97,673 | $376,121 | 3.9x |
| 46 | Shakopee | 114 | 46,012 | $107,223 | $403,598 | 3.8x |
| 47 | Inver Grove Heights | 114 | 35,906 | $101,316 | $374,324 | 3.7x |
| 48 | Chaska | 114 | 28,706 | $110,956 | $479,348 | 4.3x |
| 49 | Waconia | 114 | 13,434 | $111,031 | $458,548 | 4.1x |
| 50 | Hermantown | 114 | 10,218 | $90,849 | $416,550 | 4.6x |
| 51 | Roseville | 113 | 35,802 | $86,930 | $374,912 | 4.3x |
| 52 | New Brighton | 113 | 22,710 | $88,521 | $380,080 | 4.3x |
| 53 | Stillwater | 113 | 19,355 | $105,853 | $445,501 | 4.2x |
| 54 | Bloomington | 112 | 88,665 | $93,211 | $361,589 | 3.9x |
| 55 | Farmington | 112 | 23,902 | $123,673 | $400,171 | 3.2x |
| 56 | St. Michael | 112 | 20,010 | $131,274 | $426,652 | 3.3x |
| 57 | Hopkins | 112 | 18,819 | $75,234 | $330,893 | 4.4x |
| 58 | East Bethel | 112 | 12,115 | $110,000 | $414,303 | 3.8x |
| 59 | Champlin | 111 | 23,294 | $116,102 | $370,691 | 3.2x |
| 60 | New Hope | 110 | 21,181 | $77,662 | $350,939 | 4.5x |
| 61 | Jordan | 110 | 6,771 | $110,057 | $437,126 | 4.0x |
| 62 | Chisago City | 110 | 5,899 | $102,197 | $435,543 | 4.3x |
| 63 | Oakdale | 109 | 28,585 | $93,772 | $353,330 | 3.8x |
| 64 | Vadnais Heights | 109 | 12,838 | $98,685 | $370,284 | 3.8x |
| 65 | Mound | 109 | 9,107 | $86,675 | $378,827 | 4.4x |
| 66 | New Prague | 109 | 8,237 | $94,539 | $350,351 | 3.7x |
| 67 | Wyoming | 109 | 8,087 | $107,565 | $387,741 | 3.6x |
| 68 | Byron | 109 | 6,646 | $124,010 | $398,896 | 3.2x |
| 69 | Rochester | 108 | 122,330 | $89,389 | $339,455 | 3.8x |
| 70 | Brooklyn Park | 108 | 83,876 | $89,891 | $347,073 | 3.9x |
| 71 | White Bear Lake | 108 | 23,908 | $83,554 | $355,724 | 4.3x |
| 72 | Delano | 108 | 6,942 | $109,946 | $435,729 | 4.0x |
| 73 | Maplewood | 107 | 40,695 | $91,394 | $342,804 | 3.8x |
| 74 | Little Canada | 107 | 10,514 | $77,957 | $362,746 | 4.7x |
| 75 | St. Francis | 107 | 8,372 | $111,198 | $346,284 | 3.1x |
| 76 | Coon Rapids | 106 | 63,468 | $88,251 | $325,994 | 3.7x |
| 77 | Richfield | 106 | 36,642 | $85,132 | $347,412 | 4.1x |
| 78 | Elk River | 106 | 26,793 | $108,741 | $391,288 | 3.6x |
| 79 | Big Lake | 106 | 12,367 | $120,549 | $368,168 | 3.1x |
| 80 | Albertville | 106 | 8,207 | $132,734 | $375,310 | 2.8x |
| 81 | Fridley | 105 | 30,241 | $77,680 | $318,919 | 4.1x |
| 82 | Hastings | 105 | 22,117 | $93,998 | $378,760 | 4.0x |
| 83 | Sartell | 105 | 19,758 | $84,131 | $338,333 | 4.0x |
| 84 | Monticello | 105 | 14,858 | $79,534 | $325,077 | 4.1x |
| 85 | Mounds View | 105 | 12,926 | $90,009 | $341,297 | 3.8x |
| 86 | North St. Paul | 105 | 12,570 | $84,797 | $325,856 | 3.8x |
| 87 | North Branch | 105 | 11,565 | $90,456 | $349,510 | 3.9x |
| 88 | Columbia Heights | 104 | 22,155 | $73,691 | $295,929 | 4.0x |
| 89 | Robbinsdale | 104 | 14,234 | $88,252 | $313,988 | 3.6x |
| 90 | North Mankato | 104 | 14,211 | $80,791 | $310,329 | 3.8x |
| 91 | Baxter | 104 | 8,966 | $70,688 | $364,190 | 5.2x |
| 92 | Zimmerman | 104 | 6,546 | $85,645 | $330,831 | 3.9x |
| 93 | St. Paul | 103 | 307,284 | $73,394 | $293,972 | 4.0x |
| 94 | Crystal | 103 | 22,476 | $92,513 | $318,582 | 3.4x |
| 95 | West St. Paul | 103 | 21,382 | $68,464 | $317,548 | 4.6x |
| 96 | Northfield | 103 | 20,742 | $84,895 | $385,012 | 4.5x |
| 97 | Anoka | 103 | 17,970 | $75,948 | $326,597 | 4.3x |
| 98 | Isanti | 103 | 7,210 | $87,500 | $328,360 | 3.8x |
| 99 | St. Paul Park | 103 | 5,457 | $100,642 | $314,770 | 3.1x |
| 100 | Brooklyn Center | 102 | 32,479 | $72,535 | $297,384 | 4.1x |
Source: U.S. Census ACS 2020-2024, Zillow research. 151 places with more than 5,000 residents.
Summary
Summary: Taking A Chunk Out Of Your Paycheck In Minnesota For 2026
Well, there you have it, the places in Minnesota that have the highest cost of living, with Orono ranking as the most expensive city in the North Star State.
The most expensive cities in Minnesota are Orono, North Oaks, Shorewood, Minnetrista, Medina, Edina, Victoria, Lake Elmo, Corcoran, and Eden Prairie. Not sold on Minnesota? Take the two-minute Find Your Place quiz and see which state actually fits you.
Questions and answers
Most Expensive Places In Minnesota FAQs
What is the most expensive place to live in Minnesota?
Orono is the most expensive place to live in Minnesota for 2026. The median home there runs $1,113,974, and it posts the highest cost of living of the 151 places we scored.
What are the 10 most expensive cities in Minnesota?
The ten most expensive cities in Minnesota are Orono, North Oaks, Shorewood, Minnetrista, Medina, Edina, Victoria, Lake Elmo, Corcoran, and Eden Prairie. We ranked all 151 places with more than 5,000 residents on home prices, incomes, and an overall cost of living index.
How expensive are homes in Orono?
The median home value in Orono is $1,113,974, versus $346,668 across Minnesota as a whole. Across the ten most expensive cities, the median home runs $651,592.
What salary do you need to live in the most expensive parts of Minnesota?
The median household income in the ten most expensive Minnesota cities starts at $128,767, and in Orono it is $173,527. If your paycheck is closer to the statewide median of $89,062, these places will squeeze your budget.
What is the cheapest place to live in Minnesota?
Virginia is the cheapest of the 151 Minnesota places we ranked on cost of living. It sits at the very bottom of the same index that put Orono on top.


