
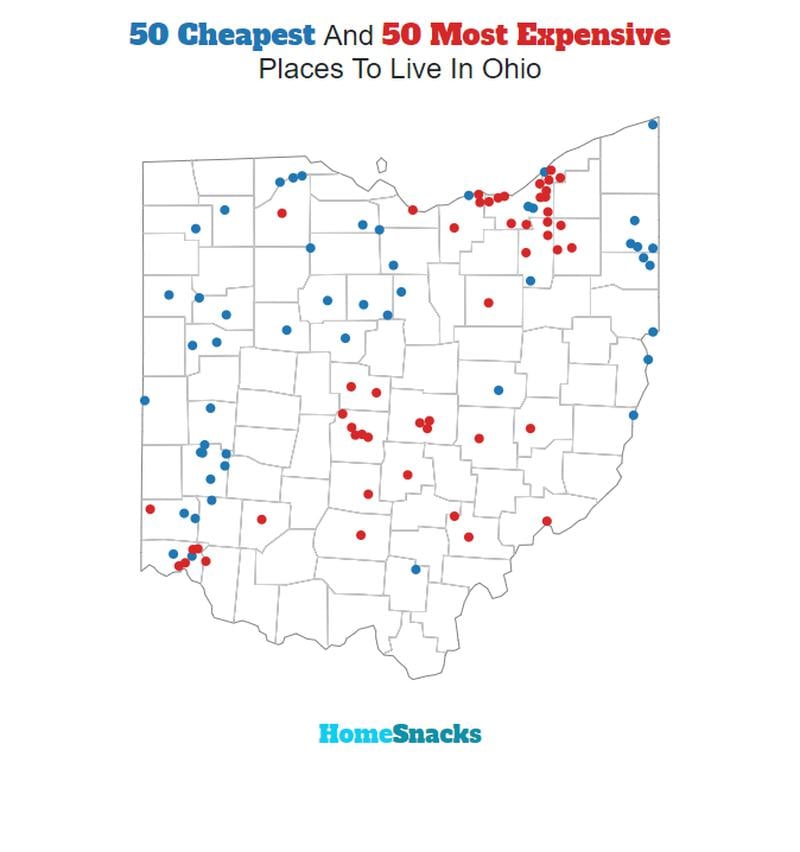
Ohio makes headlines for many reasons including the Cleveland Browns, Cincinnati’s Skyline Chili.
And, we’re happy to add to these headlines with our list of the top ten most expensive places in The Buckeye State for 2026.
To calculate our list, we used Saturday Night Science to compare the cost of living index based on housing costs and income levels data from the American Community Survey. We analyzed the latest data on the home price-to-income ratio and rent-to-income ratio for places in Ohio with at least 5,000 residents.
More importantly, many of Ohio’s most expensive places are also the state’s safest. If you want to live in one of Ohio’s most expensive places, consider attending school for a healthcare or finance degree.
Table Of Contents: Top Ten | Methodology | Summary | Table
The 10 Most Expensive Places To Live In Ohio For 2026
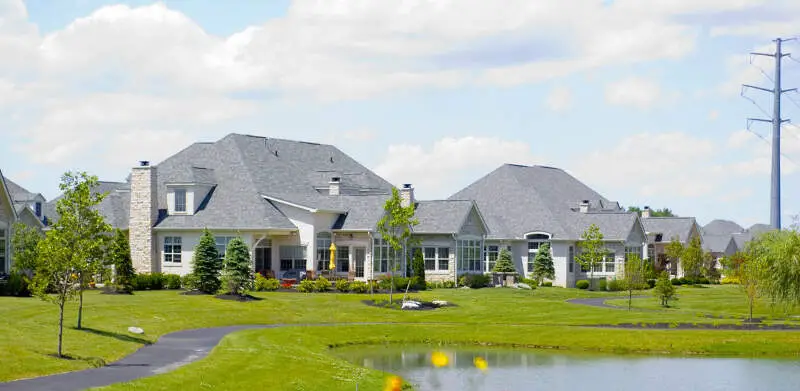
What’s the most expensive place to live in Ohio? Well, HomeSnacks crunched the numbers and discovered that The Village of Indian Hill is the most expensive place to live in Ohio.
Youngstown (the cheapest place to live in Ohio) can show these guys how to live on a budget in the coming years. Read on for how these places had costs rise faster than inflation.
And if you already knew these places were expensive, check out some more reading about Ohio and the most expensive cities in the country:
The 10 Most Expensive Places To Live In Ohio For 2026
/10
Population: 6,052
Cost Of Living Index: 216
Median Income: $234,821
Average Home Price: $1,625,643
Home Price To Income Ratio: 6.9x
More on The Village Of Indian Hill: Data | Cost Of Living | Movers
The overall cost of living in The Village Of Indian Hill is 216. The median income in The Village Of Indian Hill comes in at $234,821 and the average home value is $1,625,643 for 2026.

/10
Population: 10,896
Cost Of Living Index: 146
Median Income: $238,250
Average Home Price: $632,192
Home Price To Income Ratio: 2.7x
More on New Albany: Data | Crime | Cost Of Living | Movers
The overall cost of living in New Albany is 146. The median income in New Albany comes in at $238,250 and the average home value is $632,192 for 2026.

/10
Population: 6,840
Cost Of Living Index: 140
Median Income: $227,813
Average Home Price: $696,159
Home Price To Income Ratio: 3.1x
More on Pepper Pike: Data | Crime | Cost Of Living | Movers
The overall cost of living in Pepper Pike is 140. The median income in Pepper Pike comes in at $227,813 and the average home value is $696,159 for 2026.

/10
Population: 36,293
Cost Of Living Index: 132
Median Income: $155,167
Average Home Price: $632,819
Home Price To Income Ratio: 4.1x
More on Upper Arlington: Data | Crime | Cost Of Living | Movers
The overall cost of living in Upper Arlington is 132. The median income in Upper Arlington comes in at $155,167 and the average home value is $632,819 for 2026.

/10
Population: 8,647
Cost Of Living Index: 131
Median Income: $117,672
Average Home Price: $554,973
Home Price To Income Ratio: 4.7x
More on Grandview Heights: Data | Crime | Cost Of Living | Movers
The overall cost of living in Grandview Heights is 131. The median income in Grandview Heights comes in at $117,672 and the average home value is $554,973 for 2026.

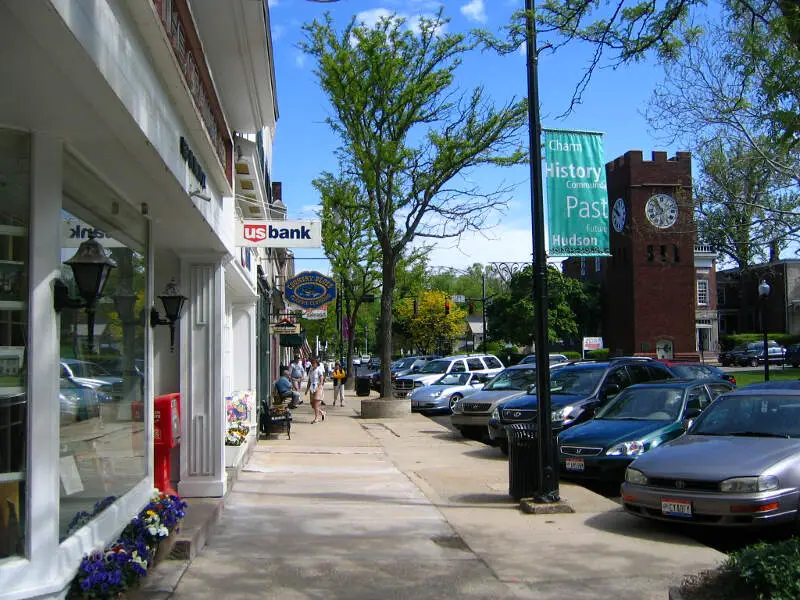
/10
Population: 23,039
Cost Of Living Index: 130
Median Income: $171,427
Average Home Price: $542,264
Home Price To Income Ratio: 3.2x
More on Hudson: Data | Crime | Cost Of Living | Movers
The overall cost of living in Hudson is 130. The median income in Hudson comes in at $171,427 and the average home value is $542,264 for 2026.

/10
Population: 13,114
Cost Of Living Index: 126
Median Income: $157,841
Average Home Price: $572,576
Home Price To Income Ratio: 3.6x
More on Bexley: Data | Crime | Cost Of Living | Movers
The overall cost of living in Bexley is 126. The median income in Bexley comes in at $157,841 and the average home value is $572,576 for 2026.

/10
Population: 49,294
Cost Of Living Index: 125
Median Income: $160,296
Average Home Price: $559,786
Home Price To Income Ratio: 3.5x
More on Dublin: Data | Crime | Cost Of Living | Movers
The overall cost of living in Dublin is 125. The median income in Dublin comes in at $160,296 and the average home value is $559,786 for 2026.

/10
Population: 14,451
Cost Of Living Index: 125
Median Income: $195,495
Average Home Price: $567,815
Home Price To Income Ratio: 2.9x
More on Powell: Data | Crime | Cost Of Living | Movers
The overall cost of living in Powell is 125. The median income in Powell comes in at $195,495 and the average home value is $567,815 for 2026.

/10
Population: 10,855
Cost Of Living Index: 122
Median Income: $150,995
Average Home Price: $677,976
Home Price To Income Ratio: 4.5x
More on Montgomery: Data | Crime | Cost Of Living | Movers
The overall cost of living in Montgomery is 122. The median income in Montgomery comes in at $150,995 and the average home value is $677,976 for 2026.
Methodology: How We Determined The Most Expensive Places To Live In The Buckeye State For 2026
The two most important things to think about when it comes to being able to afford a city in Ohio are:
- How much money do I make?
- How much do I have to spend to live there?
You need to understand your costs in the context of how much money you make.
For example, if the median household earns $100,000 and spends $40,000 on housing, it’s actually cheaper to live there than a place with a median income of $50,000 and housing costs of $21,000. You might spend more on housing, but you have more money overall to play with.
With that example in mind, we derived several statistics from the latest Census American Community Survey 2020-2024 around incomes and costs. They are:
- Overall Cost Of Living Index
- Median Home Price / Median Income (lower is better)
- Median Income / Median Rent (Higher is better)
- Median Home Price
You can then compare these metrics in each of the places in Ohio to figure out which is the most expensive.
You are left with a “Cost of Living Index” by taking the average rank of each of these metrics for each city.
So we used that cost of living index to rank all of the 247 places in Ohio that have more than 5,000 people.
The place with the highest cost of living in Ohio according to the data is The Village of Indian Hill. We updated this article for 2026. This article is our eleventh time ranking the most expensive places to live in Ohio.
Summary: Taking A Chunk Out Of Your Paycheck In Ohio For 2026
Well, there you have it, the places in Ohio that have the highest cost of living, with The Village of Indian Hill ranking as the most expensive city in the Buckeye State.
The most expensive cities in Ohio are The Village of Indian Hill, New Albany, Pepper Pike, Upper Arlington, Grandview Heights, Hudson, Bexley, Dublin, Powell, and Montgomery.
Here’s a look at the most affordable cities in Ohio according to the data:
- Youngstown
- East Liverpool
- Campbell
For more Ohio reading, check out:
- Best Places To Live In Ohio
- Cheapest Places To Live In Ohio
- Most Dangerous Cities In Ohio
- Best Places To Raise A Family In Ohio
- Safest Places In Ohio
- Worst Places To Live In Ohio
Most Expensive Cities In Ohio
| Rank | City | Cost Of Living | Population | Median Income | Average Home Price | Home/Income Ratio |
|---|---|---|---|---|---|---|
| 1 | The Village of Indian Hill | 216 | 6,052 | $234,821 | $1,625,643 | 6.9x |
| 2 | New Albany | 146 | 10,896 | $238,250 | $632,192 | 2.7x |
| 3 | Pepper Pike | 140 | 6,840 | $227,813 | $696,159 | 3.1x |
| 4 | Upper Arlington | 132 | 36,293 | $155,167 | $632,819 | 4.1x |
| 5 | Grandview Heights | 131 | 8,647 | $117,672 | $554,973 | 4.7x |
| 6 | Hudson | 130 | 23,039 | $171,427 | $542,264 | 3.2x |
| 7 | Bexley | 126 | 13,114 | $157,841 | $572,576 | 3.6x |
| 8 | Dublin | 125 | 49,294 | $160,296 | $559,786 | 3.5x |
| 9 | Powell | 125 | 14,451 | $195,495 | $567,815 | 2.9x |
| 10 | Montgomery | 122 | 10,855 | $150,995 | $677,976 | 4.5x |
| 11 | Granville | 122 | 5,999 | $124,408 | $507,108 | 4.1x |
| 12 | Beachwood | 119 | 13,865 | $106,748 | $483,433 | 4.5x |
| 13 | Madeira | 118 | 9,484 | $167,653 | $531,046 | 3.2x |
| 14 | Highland Heights | 118 | 8,623 | $122,863 | $418,478 | 3.4x |
| 15 | Mason | 117 | 35,509 | $125,401 | $510,361 | 4.1x |
| 16 | Brecksville | 116 | 13,692 | $135,000 | $437,032 | 3.2x |
| 17 | Wyoming | 116 | 8,723 | $165,188 | $483,220 | 2.9x |
| 18 | Aurora | 115 | 17,581 | $127,886 | $428,906 | 3.4x |
| 19 | Avon | 114 | 25,317 | $135,915 | $471,402 | 3.5x |
| 20 | Solon | 114 | 23,943 | $139,089 | $452,827 | 3.3x |
| 21 | Blue Ash | 113 | 13,455 | $115,313 | $447,597 | 3.9x |
| 22 | Willoughby Hills | 112 | 9,975 | $67,214 | $349,448 | 5.2x |
| 23 | Worthington | 111 | 14,938 | $127,382 | $478,890 | 3.8x |
| 24 | Westlake | 110 | 34,104 | $112,200 | $414,010 | 3.7x |
| 25 | Avon Lake | 110 | 25,752 | $115,567 | $422,130 | 3.7x |
| 26 | Kirtland | 110 | 6,911 | $110,455 | $404,639 | 3.7x |
| 27 | Hilliard | 109 | 38,033 | $128,189 | $384,174 | 3.0x |
| 28 | Springboro | 109 | 19,980 | $119,659 | $427,301 | 3.6x |
| 29 | Bay Village | 109 | 15,984 | $132,254 | $410,254 | 3.1x |
| 30 | Westerville | 108 | 38,645 | $109,404 | $446,094 | 4.1x |
| 31 | Pickerington | 108 | 24,477 | $111,833 | $419,072 | 3.7x |
| 32 | Rocky River | 108 | 21,490 | $94,026 | $393,092 | 4.2x |
| 33 | Gahanna | 104 | 35,486 | $109,061 | $374,129 | 3.4x |
| 34 | Twinsburg | 104 | 19,410 | $99,144 | $354,963 | 3.6x |
| 35 | Independence | 104 | 7,534 | $115,733 | $354,544 | 3.1x |
| 36 | Shaker Heights | 103 | 28,922 | $104,073 | $342,442 | 3.3x |
| 37 | Macedonia | 103 | 12,152 | $101,285 | $339,073 | 3.3x |
| 38 | Grove City | 102 | 42,517 | $93,161 | $330,211 | 3.5x |
| 39 | North Royalton | 102 | 30,972 | $83,670 | $334,791 | 4.0x |
| 40 | Pataskala | 102 | 18,223 | $92,033 | $382,770 | 4.2x |
| 41 | South Lebanon | 102 | 6,712 | $104,511 | $386,045 | 3.7x |
| 42 | Beavercreek | 101 | 47,126 | $110,088 | $332,151 | 3.0x |
| 43 | Strongsville | 101 | 45,983 | $103,253 | $360,030 | 3.5x |
| 44 | Marysville | 101 | 27,518 | $92,619 | $364,500 | 3.9x |
| 45 | Perrysburg | 101 | 25,181 | $111,643 | $330,761 | 3.0x |
| 46 | Broadview Heights | 101 | 19,771 | $103,125 | $365,132 | 3.5x |
| 47 | North Ridgeville | 100 | 36,627 | $96,698 | $325,233 | 3.4x |
| 48 | Loveland | 100 | 13,197 | $94,323 | $445,807 | 4.7x |
| 49 | Waterville | 100 | 6,017 | $104,114 | $340,487 | 3.3x |
| 50 | Chardon | 100 | 5,249 | $86,613 | $363,602 | 4.2x |
| 51 | St. Clairsville | 100 | 5,003 | $76,480 | $203,090 | 2.7x |
| 52 | Mentor | 99 | 47,171 | $88,949 | $269,568 | 3.0x |
| 53 | Delaware | 99 | 44,589 | $99,786 | $407,929 | 4.1x |
| 54 | Monroe | 99 | 15,401 | $105,250 | $352,114 | 3.3x |
| 55 | University Heights | 99 | 13,394 | $96,971 | $278,810 | 2.9x |
| 56 | Reynoldsburg | 98 | 41,224 | $72,972 | $295,551 | 4.1x |
| 57 | Stow | 98 | 34,240 | $93,727 | $284,989 | 3.0x |
| 58 | Oxford | 98 | 21,753 | $40,764 | $334,773 | 8.2x |
| 59 | Lyndhurst | 98 | 13,801 | $91,238 | $230,586 | 2.5x |
| 60 | Seven Hills | 98 | 11,603 | $97,222 | $299,505 | 3.1x |
| 61 | Canal Winchester | 98 | 10,170 | $131,209 | $415,360 | 3.2x |
| 62 | Groveport | 98 | 5,900 | $93,586 | $311,011 | 3.3x |
| 63 | Brunswick | 97 | 35,246 | $90,663 | $313,496 | 3.5x |
| 64 | Green | 97 | 27,393 | $95,047 | $315,865 | 3.3x |
| 65 | Tallmadge | 97 | 18,335 | $89,410 | $282,064 | 3.2x |
| 66 | Middleburg Heights | 97 | 15,786 | $78,815 | $271,582 | 3.4x |
| 67 | Columbus | 96 | 914,802 | $66,082 | $245,979 | 3.7x |
| 68 | North Olmsted | 96 | 31,924 | $84,363 | $270,520 | 3.2x |
| 69 | Centerville | 96 | 25,205 | $85,492 | $383,031 | 4.5x |
| 70 | Athens | 96 | 23,396 | $38,204 | $238,566 | 6.2x |
| 71 | Sylvania | 96 | 19,055 | $100,189 | $319,898 | 3.2x |
| 72 | Streetsboro | 96 | 17,661 | $90,274 | $279,256 | 3.1x |
| 73 | Bellbrook | 96 | 7,394 | $111,513 | $317,414 | 2.8x |
| 74 | Fairfield | 95 | 44,828 | $77,937 | $279,551 | 3.6x |
| 75 | Bowling Green | 95 | 29,983 | $45,154 | $259,039 | 5.7x |
| 76 | Medina | 95 | 25,950 | $77,385 | $374,183 | 4.8x |
| 77 | Lebanon | 95 | 21,501 | $83,685 | $397,421 | 4.7x |
| 78 | New Franklin | 95 | 13,843 | $90,244 | $241,577 | 2.7x |
| 79 | Harrison | 95 | 13,084 | $100,000 | $316,154 | 3.2x |
| 80 | Olmsted Falls | 95 | 8,639 | $96,837 | $297,060 | 3.1x |
| 81 | Milford | 95 | 6,497 | $78,057 | $331,271 | 4.2x |
| 82 | Cincinnati | 94 | 311,224 | $52,909 | $249,567 | 4.7x |
| 83 | Lakewood | 94 | 50,007 | $68,954 | $286,113 | 4.1x |
| 84 | Willoughby | 94 | 24,046 | $71,309 | $239,414 | 3.4x |
| 85 | Mayfield Heights | 94 | 20,022 | $66,524 | $228,638 | 3.4x |
| 86 | Miamisburg | 94 | 19,948 | $82,900 | $261,698 | 3.2x |
| 87 | Fairview Park | 94 | 17,018 | $78,865 | $278,444 | 3.5x |
| 88 | Sharonville | 94 | 14,030 | $74,649 | $284,334 | 3.8x |
| 89 | Tipp City | 94 | 10,439 | $78,098 | $344,989 | 4.4x |
| 90 | Germantown | 94 | 5,825 | $90,125 | $265,381 | 2.9x |
| 91 | Cuyahoga Falls | 93 | 50,909 | $72,705 | $213,993 | 2.9x |
| 92 | Forest Park | 93 | 20,025 | $75,956 | $237,983 | 3.1x |
| 93 | Berea | 93 | 18,218 | $74,926 | $239,039 | 3.2x |
| 94 | Maumee | 93 | 13,715 | $80,833 | $277,736 | 3.4x |
| 95 | Clayton | 93 | 13,277 | $92,879 | $253,570 | 2.7x |
| 96 | Norton | 93 | 11,524 | $90,464 | $244,015 | 2.7x |
| 97 | Springdale | 93 | 11,033 | $67,903 | $234,178 | 3.4x |
| 98 | Heath | 93 | 10,644 | $71,917 | $303,571 | 4.2x |
| 99 | Fairlawn | 93 | 7,711 | $97,055 | $309,742 | 3.2x |
| 100 | Huron | 93 | 6,757 | $78,333 | $298,446 | 3.8x |