
Before you decide to relocate to Utah, it’s important to research the exact cost of living around the state. And that’s what we’re going to help you do.
These are the places in Utah that cost a pretty penny — the most expensive cities in the state.
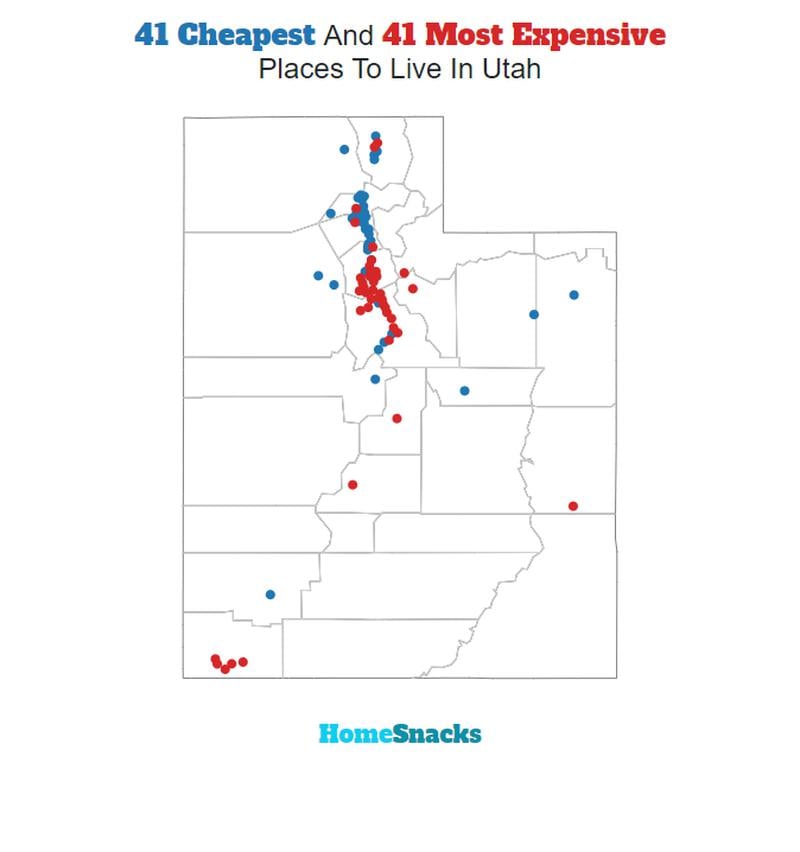
We used Saturday Night Science to compare the 2019-2023 American Community Survey on cost of living for the 89 places in Utah with more than 5,000 people.
After we saved up for months and could finally afford it, we landed on this list of the ten most expensive cities in Utah for 2025.
Table Of Contents: Top Ten | Methodology | Summary | Table
The 10 Most Expensive Places To Live In Utah For 2025
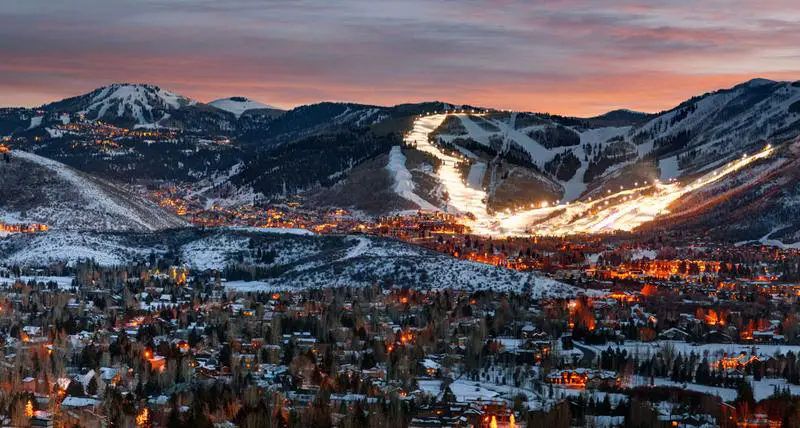
What’s the most expensive place to live in Utah? Well, HomeSnacks crunched the numbers and discovered that Park City is the most expensive place to live in Utah.
Price (the cheapest place to live in Utah) can show these guys how to live on a budget in the coming years. Read on for how these places had costs rise faster than inflation.
And if you already knew these places were expensive, check out some more reading about Utah and the most expensive cities in the country:
The 10 Most Expensive Places To Live In Utah For 2025

/10
Population: 8,365
Cost Of Living Index: 184
Median Income: $140,875
Average Home Price: $1,739,700
Home Price To Income Ratio: 12.3x
More on Park City: Data
The overall cost of living in Park City is 184. The median income in Park City comes in at $140,875 and the average home value is $1,739,700 for 2025.

/10
Population: 19,625
Cost Of Living Index: 141
Median Income: $178,662
Average Home Price: $846,900
Home Price To Income Ratio: 4.7x
More on Highland: Data
The overall cost of living in Highland is 141. The median income in Highland comes in at $178,662 and the average home value is $846,900 for 2025.

/10
Population: 10,272
Cost Of Living Index: 135
Median Income: $156,786
Average Home Price: $893,400
Home Price To Income Ratio: 5.7x
More on Alpine: Data
The overall cost of living in Alpine is 135. The median income in Alpine comes in at $156,786 and the average home value is $893,400 for 2025.

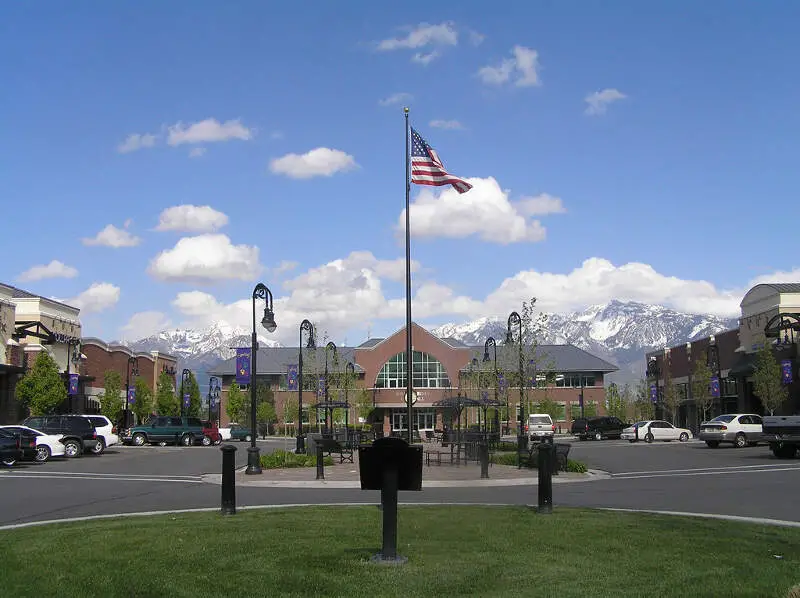
/10
Population: 50,159
Cost Of Living Index: 130
Median Income: $130,680
Average Home Price: $726,000
Home Price To Income Ratio: 5.6x
More on Draper: Data
The overall cost of living in Draper is 130. The median income in Draper comes in at $130,680 and the average home value is $726,000 for 2025.
5. Vineyard
/10
Population: 13,510
Cost Of Living Index: 130
Median Income: $100,022
Average Home Price: $562,600
Home Price To Income Ratio: 5.6x
More on Vineyard:
The overall cost of living in Vineyard is 130. The median income in Vineyard comes in at $100,022 and the average home value is $562,600 for 2025.
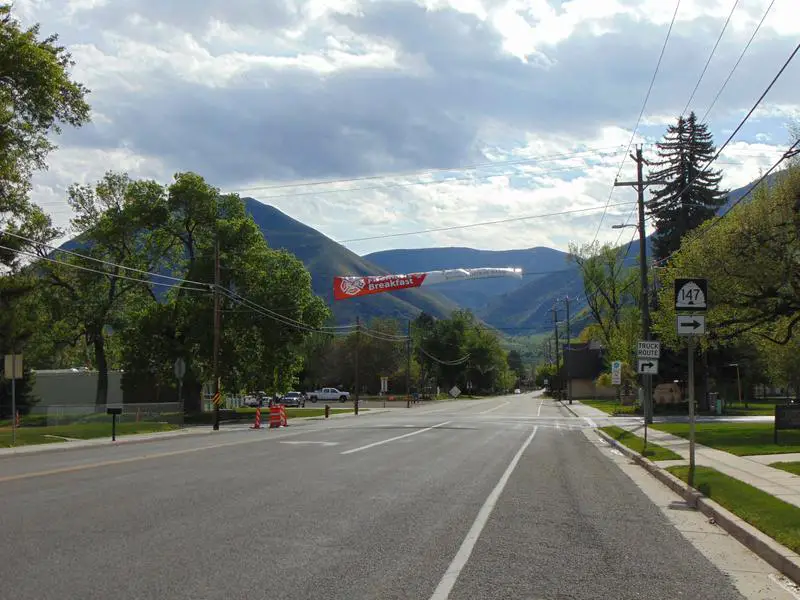
6. Midway
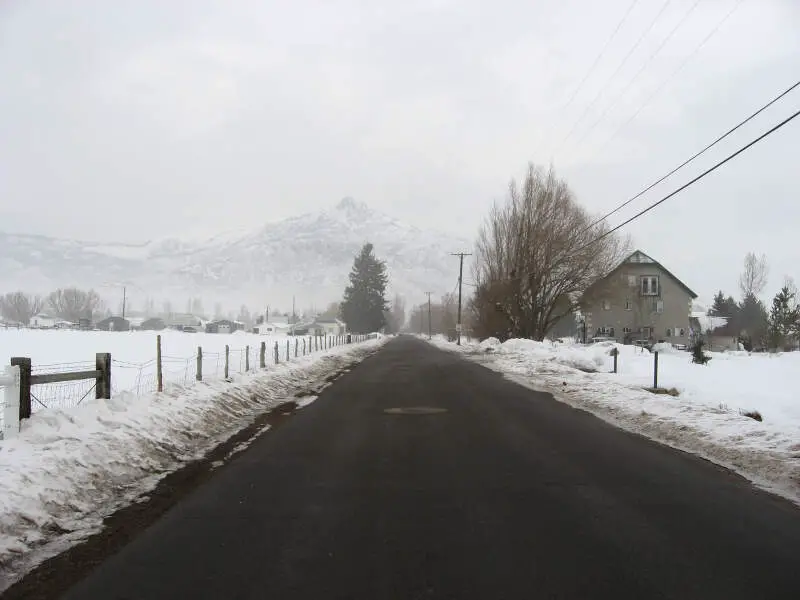
/10
Population: 6,110
Cost Of Living Index: 129
Median Income: $146,750
Average Home Price: $856,100
Home Price To Income Ratio: 5.8x
More on Midway:
The overall cost of living in Midway is 129. The median income in Midway comes in at $146,750 and the average home value is $856,100 for 2025.

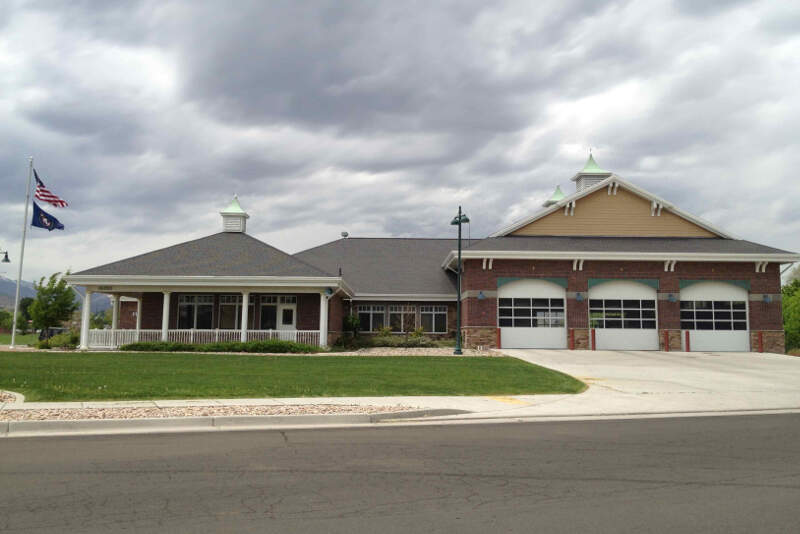
/10
Population: 18,168
Cost Of Living Index: 127
Median Income: $122,879
Average Home Price: $652,000
Home Price To Income Ratio: 5.3x
More on Bluffdale: Data
The overall cost of living in Bluffdale is 127. The median income in Bluffdale comes in at $122,879 and the average home value is $652,000 for 2025.

/10
Population: 80,331
Cost Of Living Index: 125
Median Income: $126,400
Average Home Price: $614,800
Home Price To Income Ratio: 4.9x
More on South Jordan: Data
The overall cost of living in South Jordan is 125. The median income in South Jordan comes in at $126,400 and the average home value is $614,800 for 2025.

/10
Population: 12,340
Cost Of Living Index: 125
Median Income: $127,860
Average Home Price: $734,100
Home Price To Income Ratio: 5.7x
More on Mapleton: Data
The overall cost of living in Mapleton is 125. The median income in Mapleton comes in at $127,860 and the average home value is $734,100 for 2025.

/10
Population: 9,945
Cost Of Living Index: 123
Median Income: $137,527
Average Home Price: $615,900
Home Price To Income Ratio: 4.5x
More on Cedar Hills: Data
The overall cost of living in Cedar Hills is 123. The median income in Cedar Hills comes in at $137,527 and the average home value is $615,900 for 2025.
Methodology: How We Determined The Most Expensive Places To Live In The Beehive State For 2025
The two most important things to think about when it comes to being able to afford a city in Utah are:
- How much money do I make?
- How much do I have to spend to live there?
You need to understand your costs in the context of how much money you make.
For example, if the median household earns $100,000 and spends $40,000 on housing, it’s actually cheaper to live there than a place with a median income of $50,000 and housing costs of $21,000. You might spend more on housing, but you have more money overall to play with.
With that example in mind, we derived several statistics from the latest Census American Community Survey 2019-2023 around incomes and costs. They are:
- Overall Cost Of Living Index
- Median Home Price / Median Income (lower is better)
- Median Income / Median Rent (Higher is better)
- Median Home Price
You can then compare these metrics in each of the places in Utah to figure out which is the most expensive.
You are left with a “Cost of Living Index” by taking the average rank of each of these metrics for each city.
So we used that cost of living index to rank all of the 89 places in Utah that have more than 5,000 people.
The place with the highest cost of living in Utah according to the data is Park City. We updated this article for 2025. This article is our tenth time ranking the most expensive places to live in Utah.
Summary: Taking A Chunk Out Of Your Paycheck In Utah For 2025
Well, there you have it, the places in Utah that have the highest cost of living, with Park City ranking as the most expensive city in the Beehive State.
The most expensive cities in Utah are Park City, Highland, Alpine, Draper, Vineyard, Midway, Bluffdale, South Jordan, Mapleton, and Cedar Hills.
Here’s a look at the most affordable cities in Utah according to the data:
- Price
- Brigham City
- Ogden
For more Utah reading, check out:
- Best Places To Live In Utah
- Cheapest Places To Live In Utah
- Most Dangerous Cities In Utah
- Best Places To Raise A Family In Utah
- Safest Places In Utah
- Worst Places To Live In Utah
Most Expensive Cities In Utah
| Rank | City | Cost Of Living | Population | Median Income | Average Home Price | Home/Income Ratio |
|---|---|---|---|---|---|---|
| 1 | Park City | 184 | 8,365 | $140,875 | $1,739,700 | 12.3x |
| 2 | Highland | 141 | 19,625 | $178,662 | $846,900 | 4.7x |
| 3 | Alpine | 135 | 10,272 | $156,786 | $893,400 | 5.7x |
| 4 | Draper | 130 | 50,159 | $130,680 | $726,000 | 5.6x |
| 5 | Vineyard | 130 | 13,510 | $100,022 | $562,600 | 5.6x |
| 6 | Midway | 129 | 6,110 | $146,750 | $856,100 | 5.8x |
| 7 | Bluffdale | 127 | 18,168 | $122,879 | $652,000 | 5.3x |
| 8 | South Jordan | 125 | 80,331 | $126,400 | $614,800 | 4.9x |
| 9 | Mapleton | 125 | 12,340 | $127,860 | $734,100 | 5.7x |
| 10 | Cedar Hills | 123 | 9,945 | $137,527 | $615,900 | 4.5x |
| 11 | Holladay | 122 | 31,236 | $112,369 | $700,100 | 6.2x |
| 12 | Cottonwood Heights | 121 | 32,984 | $116,583 | $641,900 | 5.5x |
| 13 | Lindon | 121 | 11,594 | $104,583 | $638,300 | 6.1x |
| 14 | Fruit Heights | 120 | 6,036 | $134,500 | $654,800 | 4.9x |
| 15 | Farmington | 119 | 24,934 | $120,432 | $618,400 | 5.1x |
| 16 | Herriman | 117 | 57,336 | $118,446 | $554,900 | 4.7x |
| 17 | Riverton | 117 | 44,944 | $119,093 | $543,900 | 4.6x |
| 18 | Sandy | 116 | 94,723 | $111,242 | $562,500 | 5.1x |
| 19 | Saratoga Springs | 116 | 44,070 | $123,619 | $567,200 | 4.6x |
| 20 | Hooper | 115 | 9,220 | $114,773 | $548,800 | 4.8x |
| 21 | Syracuse | 114 | 34,009 | $132,459 | $531,600 | 4.0x |
| 22 | Heber | 114 | 17,438 | $107,784 | $571,300 | 5.3x |
| 23 | Santa Clara | 114 | 7,891 | $93,083 | $509,600 | 5.5x |
| 24 | Lehi | 113 | 81,039 | $125,860 | $567,100 | 4.5x |
| 25 | Centerville | 112 | 16,692 | $117,831 | $492,700 | 4.2x |
| 26 | Eagle Mountain | 111 | 49,514 | $105,576 | $469,500 | 4.4x |
| 27 | North Salt Lake | 111 | 23,239 | $106,885 | $469,800 | 4.4x |
| 28 | West Haven | 111 | 19,977 | $104,307 | $511,200 | 4.9x |
| 29 | West Point | 111 | 11,559 | $118,660 | $437,800 | 3.7x |
| 30 | Salem | 111 | 9,893 | $107,617 | $547,000 | 5.1x |
| 31 | Murray | 110 | 49,904 | $87,864 | $470,200 | 5.4x |
| 32 | Bountiful | 110 | 45,093 | $103,723 | $488,900 | 4.7x |
| 33 | South Weber | 110 | 8,037 | $132,667 | $488,700 | 3.7x |
| 34 | Salt Lake City | 109 | 203,888 | $74,925 | $495,700 | 6.6x |
| 35 | Pleasant Grove | 109 | 37,544 | $96,347 | $454,300 | 4.7x |
| 36 | Woods Cross | 109 | 11,490 | $115,335 | $472,600 | 4.1x |
| 37 | Pleasant View | 109 | 11,104 | $126,679 | $526,400 | 4.2x |
| 38 | West Jordan | 108 | 116,277 | $103,960 | $454,700 | 4.4x |
| 39 | Kaysville | 108 | 32,861 | $128,996 | $583,700 | 4.5x |
| 40 | Washington | 108 | 30,686 | $94,015 | $511,100 | 5.4x |
| 41 | Ivins | 108 | 9,524 | $72,263 | $542,400 | 7.5x |
| 42 | Hyde Park | 107 | 5,410 | $108,068 | $507,400 | 4.7x |
| 43 | Spanish Fork | 106 | 43,632 | $98,497 | $444,200 | 4.5x |
| 44 | American Fork | 106 | 35,312 | $95,823 | $467,900 | 4.9x |
| 45 | North Logan | 106 | 11,228 | $84,821 | $448,600 | 5.3x |
| 46 | West Bountiful | 106 | 5,920 | $127,344 | $530,500 | 4.2x |
| 47 | Midvale | 105 | 35,736 | $73,058 | $408,400 | 5.6x |
| 48 | Orem | 104 | 97,048 | $81,292 | $439,000 | 5.4x |
| 49 | North Ogden | 104 | 21,473 | $107,425 | $443,100 | 4.1x |
| 50 | Santaquin | 104 | 15,391 | $95,175 | $434,700 | 4.6x |
| 51 | Providence | 104 | 8,675 | $103,831 | $478,300 | 4.6x |
| 52 | Farr West | 104 | 7,881 | $111,875 | $509,100 | 4.6x |
| 53 | Perry | 104 | 5,708 | $99,478 | $399,400 | 4.0x |
| 54 | Provo | 103 | 114,303 | $62,800 | $437,100 | 7.0x |
| 55 | Layton | 103 | 82,512 | $99,188 | $437,400 | 4.4x |
| 56 | Taylorsville | 103 | 59,010 | $85,608 | $398,900 | 4.7x |
| 57 | West Valley City | 102 | 137,955 | $88,604 | $377,300 | 4.3x |
| 58 | St. George | 102 | 99,184 | $72,870 | $456,900 | 6.3x |
| 59 | Springville | 102 | 35,474 | $88,516 | $429,200 | 4.8x |
| 60 | Clinton | 102 | 23,492 | $109,915 | $412,200 | 3.8x |
| 61 | Moab | 102 | 5,316 | $55,333 | $478,700 | 8.7x |
| 62 | South Salt Lake | 101 | 26,277 | $68,035 | $390,400 | 5.7x |
| 63 | Plain City | 101 | 8,101 | $126,250 | $532,300 | 4.2x |
| 64 | Nibley | 101 | 7,651 | $105,726 | $399,100 | 3.8x |
| 65 | Payson | 100 | 22,205 | $84,286 | $388,200 | 4.6x |
| 66 | Hurricane | 100 | 21,677 | $67,424 | $411,400 | 6.1x |
| 67 | Smithfield | 100 | 14,033 | $90,602 | $406,300 | 4.5x |
| 68 | Grantsville | 100 | 13,637 | $97,216 | $432,200 | 4.4x |
| 69 | Ephraim | 100 | 5,805 | $71,661 | $405,600 | 5.7x |
| 70 | South Ogden | 98 | 17,563 | $81,543 | $371,100 | 4.6x |
| 71 | Harrisville | 98 | 6,919 | $75,981 | $368,200 | 4.8x |
| 72 | Nephi | 98 | 6,700 | $97,348 | $379,800 | 3.9x |
| 73 | Roy | 97 | 39,021 | $91,112 | $350,800 | 3.9x |
| 74 | Tooele | 97 | 37,265 | $88,893 | $338,400 | 3.8x |
| 75 | Cedar City | 97 | 37,202 | $63,789 | $348,000 | 5.5x |
| 76 | Vernal | 97 | 10,254 | $59,178 | $234,200 | 4.0x |
| 77 | Riverdale | 97 | 9,294 | $64,496 | $370,300 | 5.7x |
| 78 | Roosevelt | 97 | 6,960 | $72,664 | $265,300 | 3.7x |
| 79 | Richfield | 96 | 8,173 | $77,847 | $287,500 | 3.7x |
| 80 | Enoch | 96 | 7,856 | $81,767 | $335,200 | 4.1x |
| 81 | Logan | 95 | 53,923 | $56,764 | $341,000 | 6.0x |
| 82 | Clearfield | 95 | 32,895 | $75,429 | $342,000 | 4.5x |
| 83 | Tremonton | 94 | 10,886 | $72,028 | $334,300 | 4.6x |
| 84 | Hyrum | 94 | 10,022 | $85,557 | $371,500 | 4.3x |
| 85 | Washington Terrace | 94 | 9,196 | $79,971 | $332,300 | 4.2x |
| 86 | Sunset | 94 | 5,567 | $74,250 | $296,900 | 4.0x |
| 87 | Ogden | 93 | 86,973 | $70,053 | $311,300 | 4.4x |
| 88 | Brigham City | 93 | 19,796 | $66,435 | $321,500 | 4.8x |
| 89 | Price | 90 | 8,216 | $46,947 | $189,800 | 4.0x |