Most Hispanic/Latino cities in Idaho research summary. We used Saturday Night Science to analyze Idaho’s most recent Census data to determine the most Hispanic/Latino cities based on the percentage of Hispanic/Latino residents.
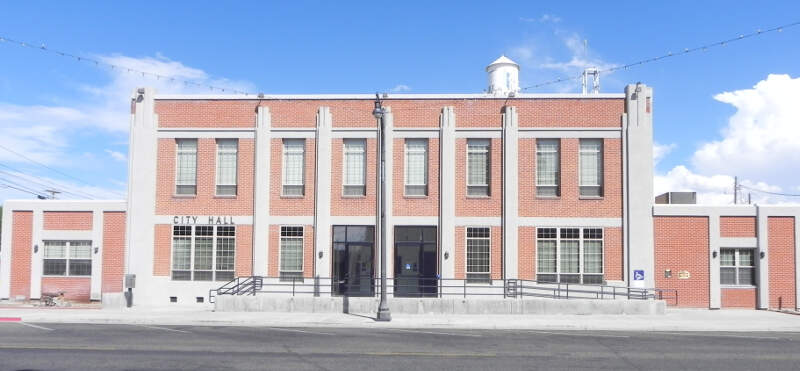
52.3% Hispanic · #1 most Hispanic in Idaho
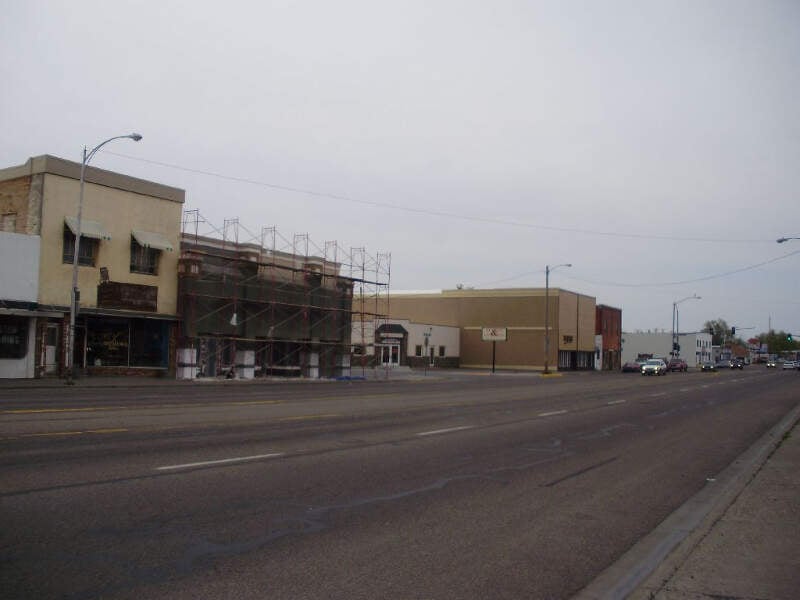
Rupert is the county seat and largest city of Minidoka County, Idaho, United States. It is part of the Burley Micropolitan Statistical Area. The population was 5,554 at the 2010 census.
Data | Crime | Cost of living | Movers
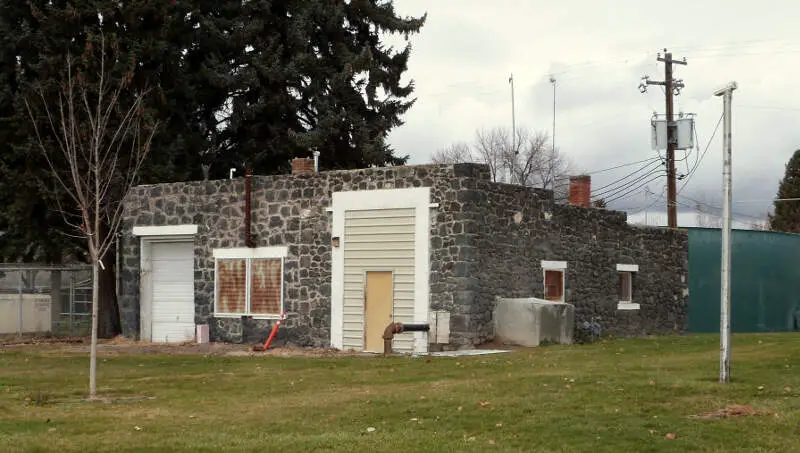
50.8% Hispanic · #2 most Hispanic in Idaho
Data | Crime | Cost of living | Movers
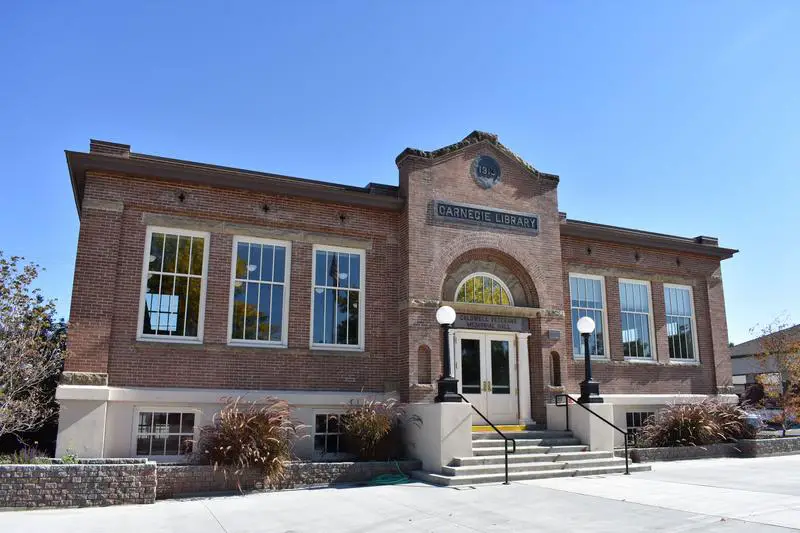
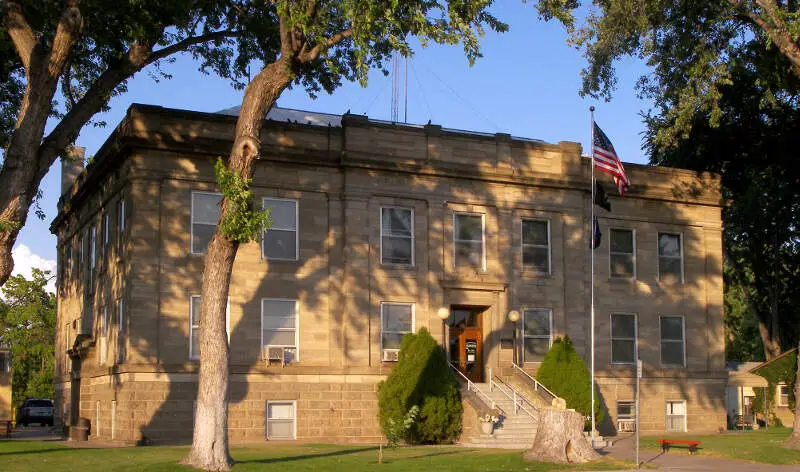
36.8% Hispanic · #3 most Hispanic in Idaho
Caldwell is a city in and the county seat of Canyon County, Idaho, United States. The population was 46,237 at the 2010 census.
Data | Crime | Cost of living | Movers

34.5% Hispanic · #4 most Hispanic in Idaho
Data | Crime | Cost of living | Movers
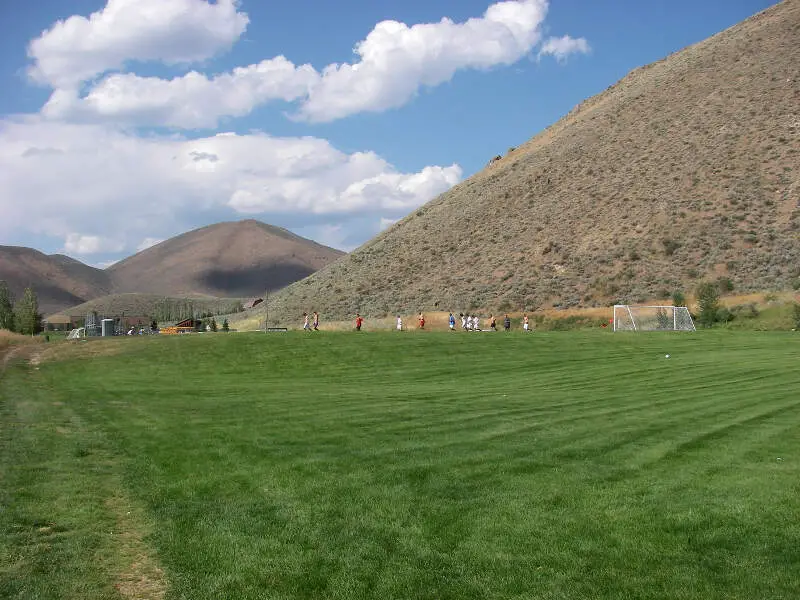
29.8% Hispanic · #5 most Hispanic in Idaho
Hailey is a city in and the county seat of Blaine County, in the Wood River Valley of the central part of the U.S. state of Idaho.
The city is named after John Hailey, a two-time Congressional delegate from the Idaho Territory.
Data | Crime | Cost of living | Movers
26.5% Hispanic · #6 most Hispanic in Idaho
Weiser is a city in the rural western part of the U.S. state of Idaho and the county seat of Washington County. With its mild climate, the city supports farm, orchard, and livestock endeavors in the vicinity. The city sits at the confluence of the Weiser River with the great Snake River, which marks the border with Oregon. The population was 5,507 at the 2010 census.
Data | Crime | Cost of living | Movers
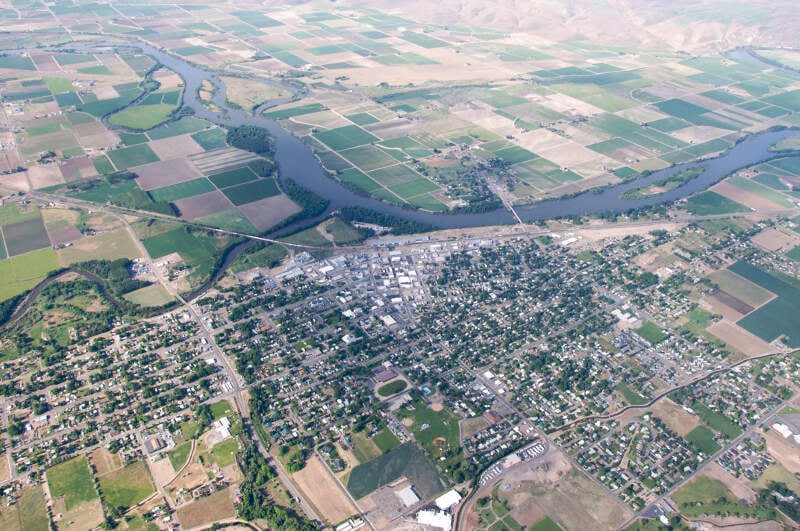
26.1% Hispanic · #7 most Hispanic in Idaho
Payette is a city in and the county seat of Payette County, Idaho, United States. The population was 7,433 at the 2010 census. It is part of the Ontario, ORID Micropolitan Statistical Area.
Data | Crime | Cost of living | Movers
25.4% Hispanic · #8 most Hispanic in Idaho
Nampa ) is the largest city of Canyon County, Idaho. The population of Nampa was 81,557 at the 2010 census making it the second-most populous city in Idaho. Nampa is located about 20 miles west of Boise along Interstate 84, and six miles west of Meridian. Nampa is the second principal city of the Boise-Nampa metropolitan area. The name “Nampa” may have come from a Shoshoni word meaning either moccasin or footprint.
Data | Crime | Cost of living | Movers
18.6% Hispanic · #9 most Hispanic in Idaho
Blackfoot is a city in Bingham County, Idaho, United States. The population was 11,899 at the 2010 census. The city is the county seat of Bingham County. Blackfoot boasts the largest potato industry in any one area, and is known as the “Potato Capital of the World.” It is the site of the Idaho Potato Museum, and the home of the world’s largest baked potato and potato chip. Blackfoot is also the location of the Eastern Idaho State Fair, which operates between Labor Day weekend and the following weekend.
Data | Crime | Cost of living | Movers
17.4% Hispanic · #10 most Hispanic in Idaho
Data | Crime | Cost of living | Movers
The receipts
Compare the top ten
Pick a metric. The bars rescale. The red line is Idaho’s statewide median.
On the map
Where Idaho’s Hispanic and Latino communities live
Saturday Night Science
Methodology: How We Determined The Cities In Idaho With The Largest Hispanic Population For 2026
We used Saturday Night Science to compare data on race from the US Census for every city in Idaho.
Idaho’s most recently available data comes from the 2020-2024 American Community Survey.
Specifically, we looked at table B03002: Hispanic OR LATINO ORIGIN BY RACE. Here are the category names as defined by the Census:
- Hispanic or Latino
- White alone*
- Black or African American alone*
- American Indian and Alaska Native alone*
- Asian alone*
- Native Hawaiian and Other Pacific Islander alone*
- Some other race alone*
- Two or more races*
Our particular column of interest here was the number of people who identified as Hispanic or Latino.
We limited our analysis to places in Idaho with a population greater than 5,000 people. That left us with 32 cities.
We then calculated the percentage of Hispanic or Latino residents in each Idaho city. The percentages ranked from 52.3% to 3.7%.
Finally, we ranked each city based on the percentage of the Hispanic or Latino population, with a higher percentage being more Hispanic or Latino. Rupert was the most Hispanic or Latino, while Rathdrum was the least Hispanic or Latino city.
We updated this article for 2026. This article represents our eleventh time ranking the cities in Idaho with the largest Hispanic/Latino population.
The full plate
Cities In Idaho By Hispanic Population
Click any column to sort. Search by city name.
| Rank | City | Population | Hispanic Population | % Hispanic |
|---|---|---|---|---|
| 1 | Rupert | 6,190 | 3,236 | 52.3% |
| 2 | Jerome | 12,930 | 6,570 | 50.8% |
| 3 | Caldwell | 66,516 | 24,478 | 36.8% |
| 4 | Burley | 11,958 | 4,122 | 34.5% |
| 5 | Hailey | 9,665 | 2,877 | 29.8% |
| 6 | Weiser | 5,935 | 1,575 | 26.5% |
| 7 | Payette | 8,536 | 2,224 | 26.1% |
| 8 | Nampa | 110,319 | 28,059 | 25.4% |
| 9 | Blackfoot | 12,782 | 2,377 | 18.6% |
| 10 | Mountain Home | 16,493 | 2,874 | 17.4% |
| 11 | Twin Falls | 54,164 | 9,382 | 17.3% |
| 12 | Idaho Falls | 67,725 | 11,286 | 16.7% |
| 13 | Middleton | 10,649 | 1,637 | 15.4% |
| 14 | Chubbuck | 16,126 | 2,407 | 14.9% |
| 15 | Emmett | 8,275 | 1,218 | 14.7% |
| 16 | Garden City | 12,654 | 1,571 | 12.4% |
| 17 | Ammon | 19,064 | 2,205 | 11.6% |
| 18 | Rexburg | 40,543 | 4,527 | 11.2% |
| 19 | Star | 14,745 | 1,597 | 10.8% |
| 20 | Meridian | 130,138 | 13,692 | 10.5% |
| 21 | Pocatello | 57,635 | 5,510 | 9.6% |
| 22 | Boise City | 237,242 | 22,671 | 9.6% |
| 23 | Kuna | 27,158 | 2,565 | 9.4% |
| 24 | Eagle | 32,855 | 2,551 | 7.8% |
| 25 | Post Falls | 43,391 | 3,060 | 7.1% |
| 26 | Moscow | 26,286 | 1,788 | 6.8% |
| 27 | Hayden | 16,338 | 1,054 | 6.5% |
| 28 | Sandpoint | 9,637 | 548 | 5.7% |
| 29 | Coeur d’Alene | 56,447 | 2,815 | 5.0% |
| 30 | Preston | 5,928 | 288 | 4.9% |
| 31 | Lewiston | 34,651 | 1,452 | 4.2% |
| 32 | Rathdrum | 10,874 | 407 | 3.7% |
Source: U.S. Census ACS 2020-2024. 32 cities with more than 5,000 residents.
Summary
Summary: Hispanic or Latino Populations Across Idaho
According to the most recent data, this is an accurate list if you’re looking for a breakdown of Latino populations for each place across Idaho.
The most Hispanic/Latino cities in Idaho are Rupert, Jerome, Caldwell, Burley, Hailey, Weiser, Payette, Nampa, Blackfoot, and Mountain Home. Not sold on Idaho? Take the two-minute Find Your Place quiz and see which state actually fits you.
Questions and answers
Most Hispanic Cities In Idaho FAQs
What is the most Hispanic city in Idaho?
Rupert is the most Hispanic or Latino city in Idaho for 2026, at 52.3% of residents. Jerome and Caldwell are next.
What cities in Idaho have the highest Hispanic population?
The Idaho cities with the highest Hispanic and Latino population shares are Rupert, Jerome, Caldwell, Burley, Hailey, Weiser, Payette, Nampa, Blackfoot, and Mountain Home. We ranked all 32 places with more than 5,000 residents.
What percent of Rupert is Hispanic?
Hispanic and Latino residents make up 52.3% of Rupert, the highest share of the 32 Idaho places we measured. The numbers come from the Census Bureau’s American Community Survey.
What is the least Hispanic city in Idaho?
Rathdrum is the least Hispanic or Latino city in Idaho, at 3.7%. It sits at the opposite end of the same ranking.
Where does this data come from?
Every share is calculated from the Census Bureau’s American Community Survey (2020-2024), based on residents identifying as Hispanic or Latino of any race. We rank each Idaho place with more than 5,000 residents.