Most Native American places in Minnesota research summary. We used Saturday Night Science to research the Minnesota cities with the highest percentage of Native American residents for 2026. The data comes from the American Community Survey 2020-2024 vintage, which breaks down race by origin.
The city with the highest percentage of Native Americans is Bemidji. 11.31% of people in Bemidji are Native Americans.
The city with the lowest percentage of Native Americans is Mounds View. 0.00% of people in Mounds View are Native American.
The city with the most Native Americans is Minneapolis. 3,045 people in Minneapolis are Native American.
The city with the fewest Native Americans is Mounds View. 0 people in Mounds View are Native American.
The United States has 1,698,432 Native Americans and is 0.51% Native American.
Which city in Minnesota had the largest Native American population? The place with the largest Native American population in Minnesota for 2026 is Bemidji. 11.31% of Bemidji identify as Native American.
11.3% Native American · 1,761 Native American residents
Bemidji is a city in Beltrami County, in north west Minnesota, United States. With a population of 14,301 as of July 1, 2016, it is the largest commercial center between Grand Forks, North Dakota and Duluth, Minnesota. Bemidji houses many Native American services, including the Indian Health Service. The city is the central hub of the Red Lake Indian Reservation, White Earth Indian Reservation and the Leech Lake Indian Reservation. Bemidji lies on the south west shore of Lake Bemidji, the northernmost lake feeding the Mississippi River and as such is deemed “The First City On The Mississippi.” Bemidji is also the self proclaimed “curling capital” of the U.S. and birth place of Paul Bunyan
Data | Crime | Cost of living | Movers
5.1% Native American · 641 Native American residents
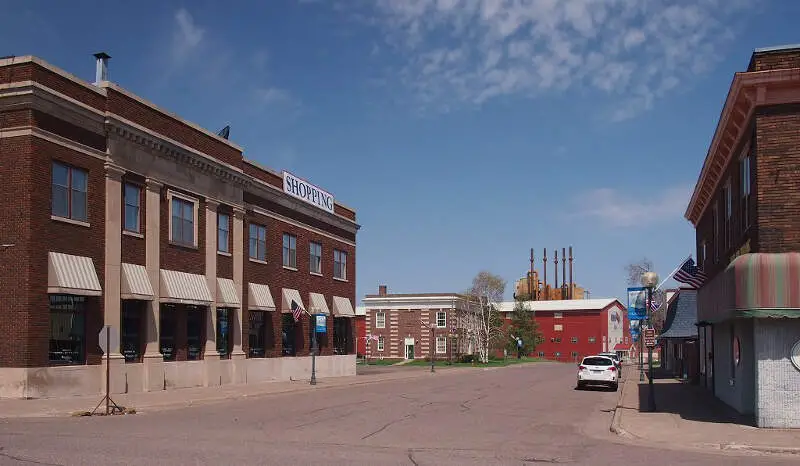
Cloquet kloh-KAY) is a city in Carlton County, Minnesota, United States, located at the junction of Interstate 35 and Minnesota State Highway 33. A portion of the city lies within the Fond du Lac Indian Reservation and also serves as one of three administrative centers for the Indian Reservation. The population was 12,124 at the 2010 census.
Data | Crime | Cost of living | Movers
4.0% Native American · 400 Native American residents
Detroit Lakes is a city in the State of Minnesota and the county seat of Becker County. The population was 8,569 at the 2010 census. Its unofficial population during summer months is much higher, estimated by citizens to peak at 13,000 midsummer, due to seasonal residents and tourists.
Data | Crime | Cost of living | Movers
3.5% Native American · 293 Native American residents
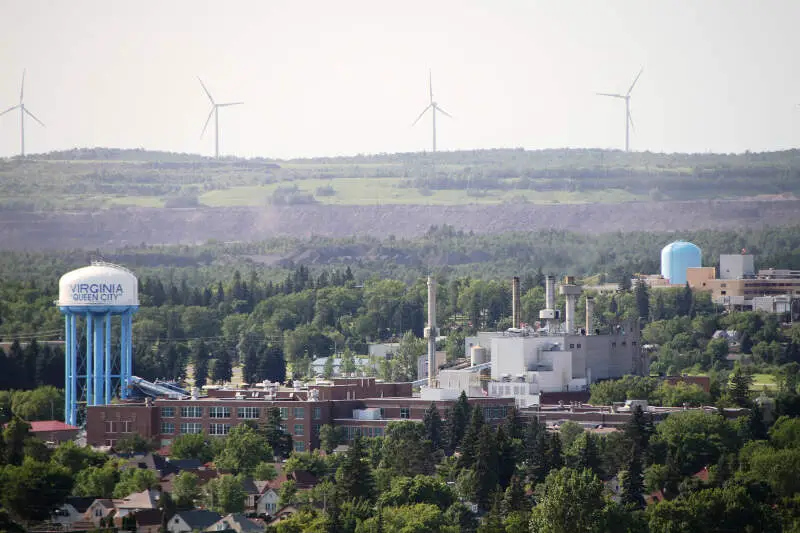
Virginia is a city in Saint Louis County, Minnesota, United States, on the Mesabi Iron Range. The population was 8,712 at the 2010 census. According to a water tower in the middle of town, the city’s nickname is the “Queen City”, or “Queen City of the North”.
Data | Crime | Cost of living | Movers
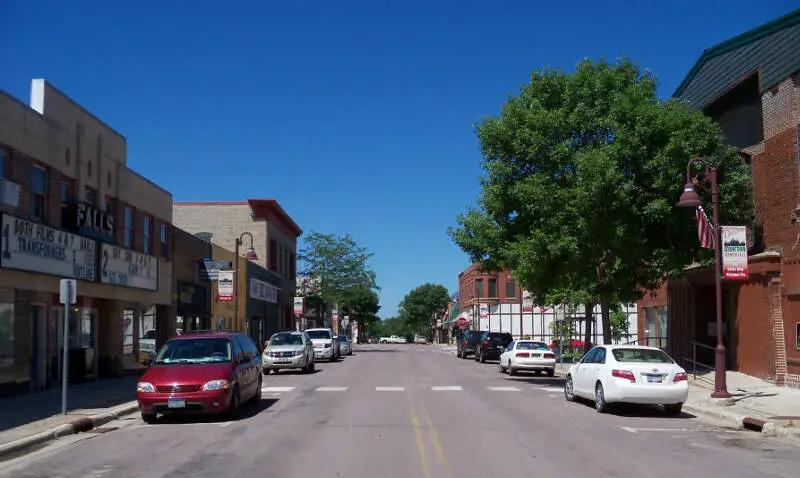
2.7% Native American · 136 Native American residents
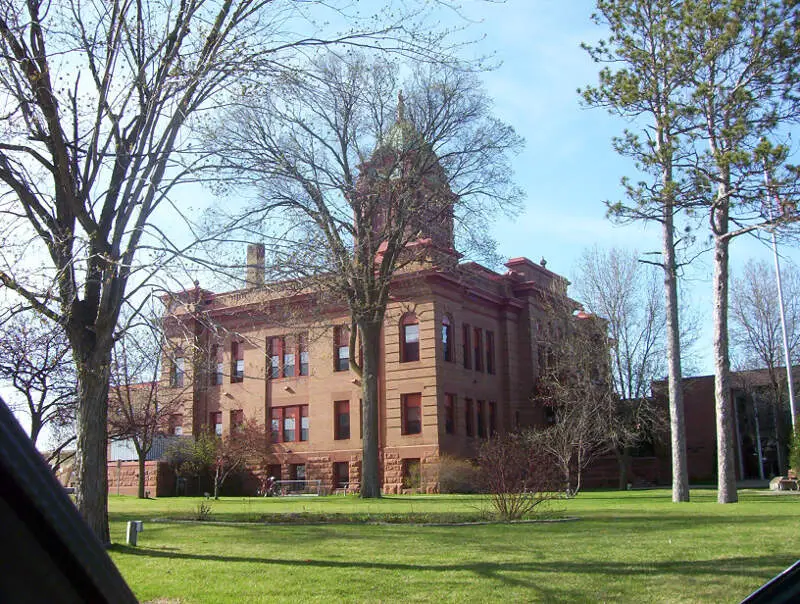
Redwood Falls is a city in Redwood County, located along the Redwood River near its confluence with the Minnesota River, in the U.S. state of Minnesota. The population was 5,254 at the 2010 census. It is the county seat.
Data | Movers
2.5% Native American · 282 Native American residents
Grand Rapids is a city in Itasca County, Minnesota, United States. The population was 10,869 at the 2010 census. It is the county seat of Itasca County.
Data | Crime | Cost of living | Movers
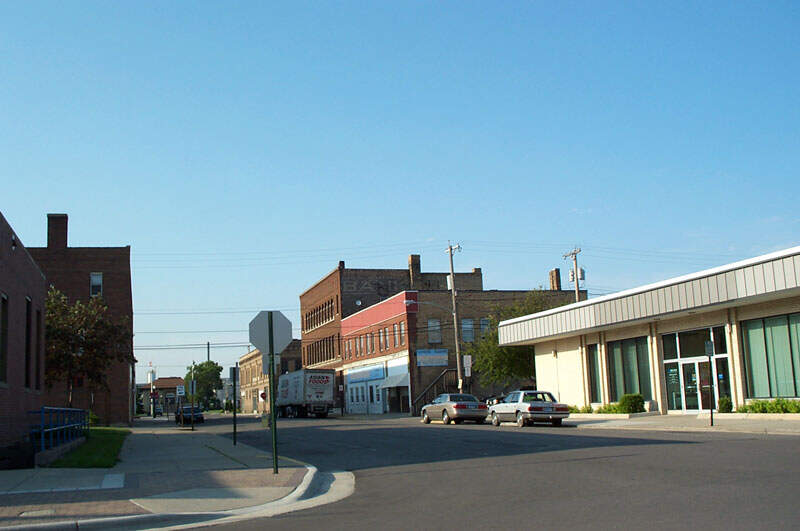
2.5% Native American · 141 Native American residents
International Falls is a city in and the county seat of Koochiching County, Minnesota, United States. The population was 6,424 at the 2010 census.
Data | Crime | Cost of living | Movers
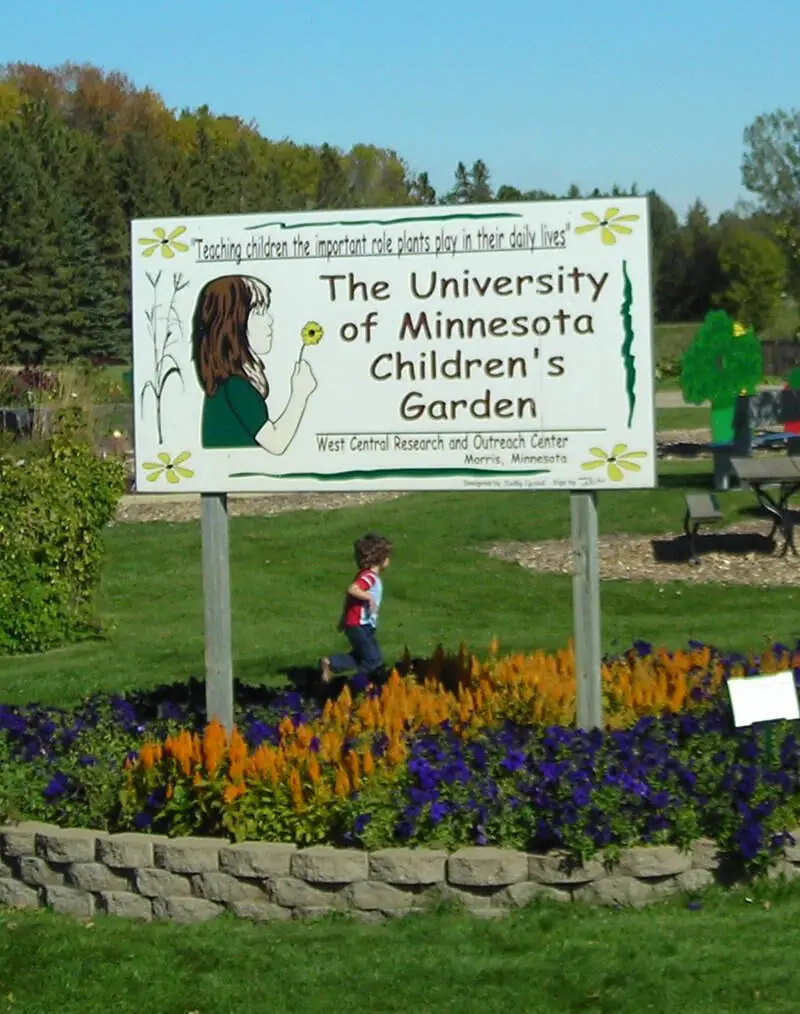
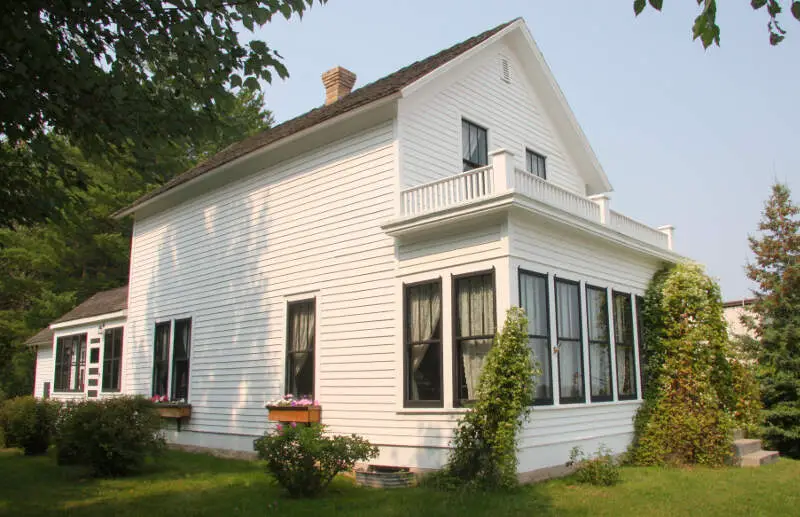
2.4% Native American · 123 Native American residents
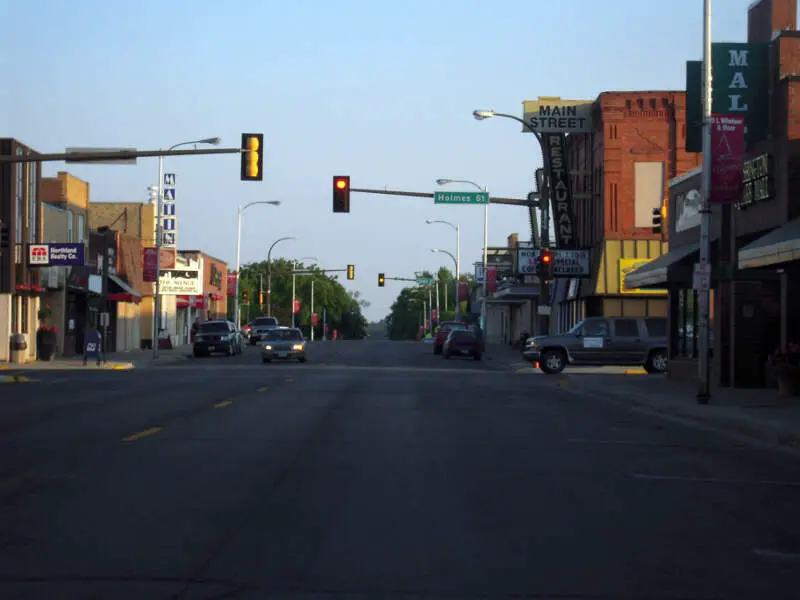
Morris is a city in Stevens County, Minnesota, United States. The population was 5,286 at the 2010 census. It is the county seat.
Data | Crime | Cost of living | Movers
1.9% Native American · 137 Native American residents
Data | Crime | Cost of living | Movers
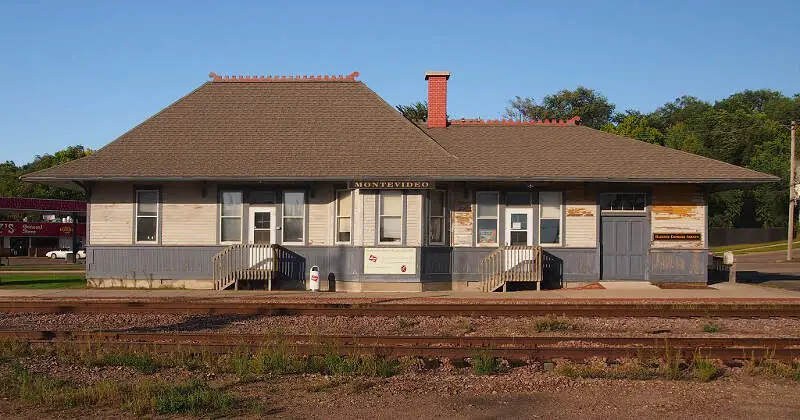
1.9% Native American · 100 Native American residents
Data | Crime | Cost of living | Movers
The receipts
Compare the top ten
Pick a metric. The bars rescale. The red line is Minnesota’s statewide median.
On the map
Where Minnesota’s Native American population is concentrated
Saturday Night Science
Methodology: How We Determined The Cities In Minnesota With The Largest Native American Population For 2026
We still believe in the accuracy of data — especially from the Census. So that’s where we went to get the race breakdown across Minnesota.
We used Saturday Night Science to analyze the Census’s most recently available data, the 2020-2024 American Community Survey data.
Specifically, we looked at table B03002: Hispanic OR LATINO ORIGIN BY RACE. Here are the category names as defined by the Census:
- Hispanic or Latino
- White alone
- Black or African American alone
- American Indian and Alaska Native alone
- Asian alone
- Native Hawaiian and Other Pacific Islander alone
- Some other race alone
- Two or more races
Our particular column of interest here was the number of people identifying as American Indian and Alaska Native alone.
We limited our analysis to places with a population greater than 5,000 people. That left us with 139 cities.
We then calculated the percentage of residents that are American Indian and Alaska Native. The percentages ranked from 11.31 to 0.00.
Finally, we ranked each city based on the percentage of the American Indian and Alaska Native population, with a higher score being more American Indian and Alaska Native than a lower score. Bemidji took the distinction of being the most American Indian and Alaska Native, while Mounds View was the least Native American city.
We updated this article for 2026. This article is our eleventh time ranking the cities in Minnesota with the largest Native American population.
The full plate
Most Native American Places In Minnesota
Click any column to sort. Search by city name.
| Rank | City | Population | Native American Population | % Native American |
|---|---|---|---|---|
| 1 | Bemidji | 15,569 | 1,761 | 11.3% |
| 2 | Cloquet | 12,537 | 641 | 5.1% |
| 3 | Detroit Lakes | 10,025 | 400 | 4.0% |
| 4 | Virginia | 8,332 | 293 | 3.5% |
| 5 | Redwood Falls | 5,068 | 136 | 2.7% |
| 6 | Grand Rapids | 11,207 | 282 | 2.5% |
| 7 | International Falls | 5,642 | 141 | 2.5% |
| 8 | Morris | 5,128 | 123 | 2.4% |
| 9 | Spring Lake Park | 7,032 | 137 | 1.9% |
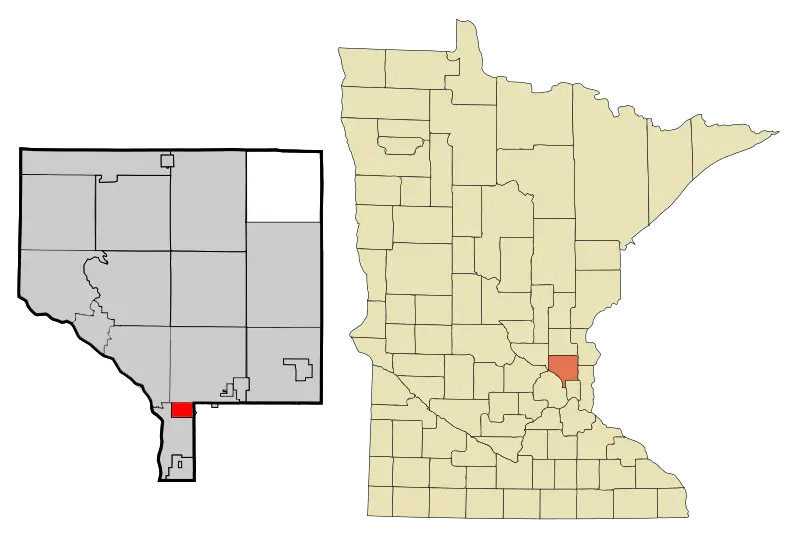
| 10 | Montevideo | 5,315 | 100 | 1.9% |
| 11 | Crookston | 7,344 | 120 | 1.6% |
| 12 | Prior Lake | 28,016 | 426 | 1.5% |
| 13 | Brainerd | 14,468 | 198 | 1.4% |
| 14 | Duluth | 87,093 | 1,162 | 1.3% |
| 15 | Red Wing | 16,758 | 201 | 1.2% |
| 16 | Minnetrista | 8,708 | 89 | 1.0% |
| 17 | Shakopee | 46,012 | 386 | 0.8% |
| 18 | Hastings | 22,117 | 182 | 0.8% |
| 19 | Waseca | 9,164 | 74 | 0.8% |
| 20 | Anoka | 17,970 | 145 | 0.8% |
| 21 | Cambridge | 10,307 | 82 | 0.8% |
| 22 | Moorhead | 45,036 | 345 | 0.8% |
| 23 | St. Francis | 8,372 | 64 | 0.8% |
| 24 | Willmar | 21,378 | 160 | 0.7% |
| 25 | Minneapolis | 427,246 | 3,045 | 0.7% |
| 26 | Vadnais Heights | 12,838 | 86 | 0.7% |
| 27 | Oakdale | 28,585 | 184 | 0.6% |
| 28 | Hermantown | 10,218 | 64 | 0.6% |
| 29 | Buffalo | 16,499 | 95 | 0.6% |
| 30 | Brooklyn Center | 32,479 | 183 | 0.6% |
| 31 | St. Anthony | 9,671 | 54 | 0.6% |
| 32 | Marshall | 13,896 | 74 | 0.5% |
| 33 | Faribault | 24,631 | 130 | 0.5% |
| 34 | Coon Rapids | 63,468 | 314 | 0.5% |
| 35 | St. Peter | 12,185 | 59 | 0.5% |
| 36 | Fridley | 30,241 | 143 | 0.5% |
| 37 | Shoreview | 26,714 | 121 | 0.5% |
| 38 | St. Paul | 307,284 | 1,283 | 0.4% |
| 39 | Thief River Falls | 8,823 | 36 | 0.4% |
| 40 | Maplewood | 40,695 | 166 | 0.4% |
| 41 | Lino Lakes | 22,113 | 89 | 0.4% |
| 42 | New Hope | 21,181 | 79 | 0.4% |
| 43 | Champlin | 23,294 | 85 | 0.4% |
| 44 | East Bethel | 12,115 | 44 | 0.4% |
| 45 | Plymouth | 79,220 | 285 | 0.4% |
| 46 | West St. Paul | 21,382 | 76 | 0.4% |
| 47 | Richfield | 36,642 | 130 | 0.4% |
| 48 | Little Canada | 10,514 | 37 | 0.4% |
| 49 | Victoria | 11,295 | 37 | 0.3% |
| 50 | Bloomington | 88,665 | 290 | 0.3% |
| 51 | Blaine | 72,488 | 201 | 0.3% |
| 52 | Little Falls | 9,121 | 25 | 0.3% |
| 53 | Baxter | 8,966 | 24 | 0.3% |
| 54 | St. Michael | 20,010 | 52 | 0.3% |
| 55 | St. Cloud | 70,629 | 175 | 0.2% |
| 56 | Fergus Falls | 14,181 | 35 | 0.2% |
| 57 | Andover | 33,035 | 80 | 0.2% |
| 58 | New Ulm | 14,056 | 33 | 0.2% |
| 59 | Big Lake | 12,367 | 29 | 0.2% |
| 60 | Lakeville | 74,354 | 161 | 0.2% |
| 61 | Mankato | 45,473 | 97 | 0.2% |
| 62 | Stillwater | 19,355 | 35 | 0.2% |
| 63 | Roseville | 35,802 | 62 | 0.2% |
| 64 | Elk River | 26,793 | 46 | 0.2% |
| 65 | Minnetonka | 53,064 | 91 | 0.2% |
| 66 | Crystal | 22,476 | 38 | 0.2% |
| 67 | South St. Paul | 20,611 | 33 | 0.2% |
| 68 | Glencoe | 5,695 | 9 | 0.2% |
| 69 | Inver Grove Heights | 35,906 | 56 | 0.2% |
| 70 | Columbia Heights | 22,155 | 34 | 0.2% |
| 71 | Savage | 32,889 | 50 | 0.2% |
| 72 | Corcoran | 7,302 | 11 | 0.2% |
| 73 | Brooklyn Park | 83,876 | 125 | 0.1% |
| 74 | Hopkins | 18,819 | 28 | 0.1% |
| 75 | North St. Paul | 12,570 | 18 | 0.1% |
| 76 | Robbinsdale | 14,234 | 20 | 0.1% |
| 77 | Golden Valley | 21,725 | 30 | 0.1% |
| 78 | Owatonna | 26,498 | 36 | 0.1% |
| 79 | Alexandria | 14,735 | 20 | 0.1% |
| 80 | Forest Lake | 20,729 | 28 | 0.1% |
| 81 | Northfield | 20,742 | 28 | 0.1% |
| 82 | Waite Park | 8,399 | 11 | 0.1% |
| 83 | Eagan | 68,000 | 89 | 0.1% |
| 84 | Chanhassen | 26,006 | 33 | 0.1% |
| 85 | Rochester | 122,330 | 153 | 0.1% |
| 86 | Sartell | 19,758 | 24 | 0.1% |
| 87 | Burnsville | 64,463 | 72 | 0.1% |
| 88 | Austin | 26,358 | 28 | 0.1% |
| 89 | North Mankato | 14,211 | 15 | 0.1% |
| 90 | Stewartville | 6,807 | 7 | 0.1% |
| 91 | St. Louis Park | 49,594 | 51 | 0.1% |
| 92 | Woodbury | 78,305 | 75 | 0.1% |
| 93 | Chaska | 28,706 | 27 | 0.1% |
| 94 | Hibbing | 16,057 | 15 | 0.1% |
| 95 | New Brighton | 22,710 | 21 | 0.1% |
| 96 | Winona | 26,009 | 24 | 0.1% |
| 97 | East Grand Forks | 9,028 | 8 | 0.1% |
| 98 | Mendota Heights | 11,612 | 10 | 0.1% |
| 99 | Mahtomedi | 8,133 | 7 | 0.1% |
| 100 | Rosemount | 27,562 | 23 | 0.1% |
Source: U.S. Census ACS 2020-2024, table B03002. 139 Minnesota cities with more than 5,000 residents.
Summary
Summary: Native American Populations Across Minnesota
If you’re looking for a breakdown of Native American populations across Minnesota according to the most recent data, this is an accurate list.
The most Native American cities in Minnesota are Bemidji, Cloquet, Detroit Lakes, Virginia, Redwood Falls, Grand Rapids, International Falls, Morris, Spring Lake Park, and Montevideo. Not sold on Minnesota? Take the two-minute Find Your Place quiz and see which state actually fits you.
Questions and answers
Native American Population In Minnesota FAQs
What city in Minnesota has the highest share of Native American residents?
Bemidji has the highest share of Native American residents in Minnesota for 2026, at 11.31% of the population. Cloquet and Detroit Lakes are next.
What city in Minnesota has the most Native American residents overall?
Minneapolis has the most Native American residents in Minnesota, with 3,045 people. That is the raw count; Bemidji leads on share of population.
What are the top Native American communities in Minnesota?
The Minnesota places with the highest Native American population shares are Bemidji, Cloquet, Detroit Lakes, Virginia, Redwood Falls, Grand Rapids, International Falls, Morris, Spring Lake Park, and Montevideo. We ranked all 139 places with more than 5,000 residents.
How many Native Americans live in the United States?
The United States has 1,698,432 residents identifying as American Indian and Alaska Native, which is 0.51% of the country. The share in Bemidji runs far above that national mark.
Where does this data come from?
Every number comes from the Census Bureau’s American Community Survey (2020-2024), table B03002, based on residents identifying as American Indian and Alaska Native. We rank each Minnesota place with more than 5,000 residents.


