Laurinburg, NC
Demographics And Statistics
Living In Laurinburg, North Carolina Summary
Life in Laurinburg research summary. HomeSnacks has been using Saturday Night Science to research the quality of life in Laurinburg over the past nine years using Census, FBI, Zillow, and other primary data sources. Based on the most recently available data, we found the following about life in Laurinburg:
The population in Laurinburg is 15,079.
The median home value in Laurinburg is $140,734.
The median income in Laurinburg is $39,258.
The cost of living in Laurinburg is 86 which is 0.9x lower than the national average.
The median rent in Laurinburg is $766.
The unemployment rate in Laurinburg is 10.3%.
The poverty rate in Laurinburg is 32.0%.
The average high in Laurinburg is 73.6° and the average low is 50.2°.
Laurinburg SnackAbility
Overall SnackAbility
Laurinburg, NC Crime Report
Crime in Laurinburg summary. We use data from the FBI to determine the crime rates in Laurinburg. Key points include:
There were 1,040 total crimes in Laurinburg in the last reporting year.
The overall crime rate per 100,000 people in Laurinburg is 6,936.1 / 100k people.
The violent crime rate per 100,000 people in Laurinburg is 1,894.1 / 100k people.
The property crime rate per 100,000 people in Laurinburg is 5,042.0 / 100k people.
Overall, crime in Laurinburg is 227.29% above the national average.
Total Crimes
Above National Average
Crime In Laurinburg Comparison Table
| Statistic | Count Raw |
Laurinburg / 100k People |
North Carolina / 100k People |
National / 100k People |
|---|---|---|---|---|
| Total Crimes Per 100K | 1,040 | 6,936.1 | 2,343.9 | 2,119.2 |
| Violent Crime | 284 | 1,894.1 | 375.8 | 359.0 |
| Murder | 9 | 60.0 | 7.5 | 5.0 |
| Robbery | 24 | 160.1 | 50.2 | 61.0 |
| Aggravated Assault | 240 | 1,600.6 | 290.1 | 256.0 |
| Property Crime | 756 | 5,042.0 | 1,968.1 | 1,760.0 |
| Burglary | 244 | 1,627.3 | 323.9 | 229.0 |
| Larceny | 450 | 3,001.2 | 1,390.2 | 1,272.0 |
| Car Theft | 62 | 413.5 | 254.1 | 259.0 |
Laurinburg, NC Cost Of Living
Cost of living in Laurinburg summary. We use data on the cost of living to determine how expensive it is to live in Laurinburg. Real estate prices drive most of the variance in cost of living around North Carolina. Key points include:
The cost of living in Laurinburg is 86 with 100 being average.
The cost of living in Laurinburg is 0.9x lower than the national average.
The median home value in Laurinburg is $140,734.
The median income in Laurinburg is $39,258.
Laurinburg's Overall Cost Of Living
Lower Than The National Average
Cost Of Living In Laurinburg Comparison Table
| Living Expense | Laurinburg | North Carolina | National Average | |
|---|---|---|---|---|
| Overall | 86 | 92 | 100 | |
| Services | 105 | 100 | 100 | |
| Groceries | 101 | 99 | 100 | |
| Health | 112 | 106 | 100 | |
| Housing | 59 | 86 | 100 | |
| Transportation | 95 | 93 | 100 | |
| Utilities | 87 | 95 | 100 | |
Laurinburg, NC Weather
The average high in Laurinburg is 73.6° and the average low is 50.2°.
There are 64.4 days of precipitation each year.
Expect an average of 45.2 inches of precipitation each year with 1.6 inches of snow.
| Stat | Laurinburg |
|---|---|
| Average Annual High | 73.6 |
| Average Annual Low | 50.2 |
| Annual Precipitation Days | 64.4 |
| Average Annual Precipitation | 45.2 |
| Average Annual Snowfall | 1.6 |
Average High
Days of Rain
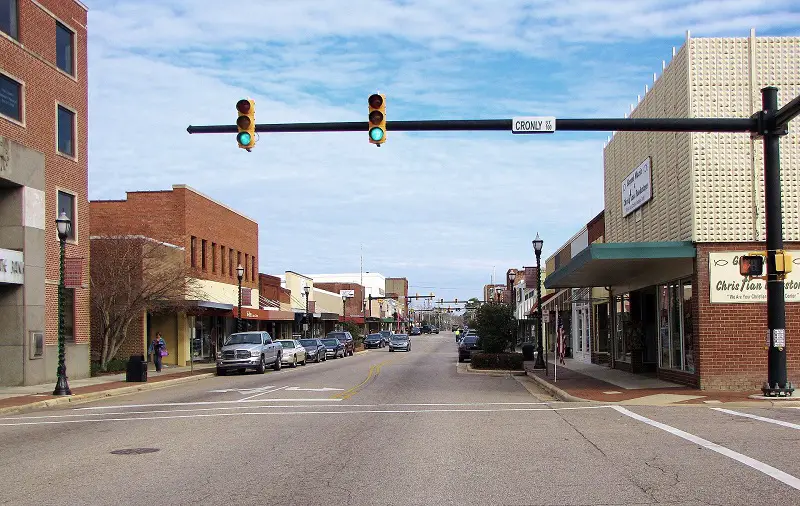
Laurinburg, NC Photos
3 Reviews & Comments About Laurinburg
/5

jay lew - None
Laurinburg should've been #1 most dangerous. I was born and raised there and was fortunate enough to get tf out.. It's a trap. DONT go there if youre not from there. You will get pressed
Sara Grooms - None
guess what i live in laurinburg and its not that f*****g crappy
HomeSnacks User - None
I moved to Laurinburg,NC a few years ago. I grew up around and in the Washington,D.C area. It is absolutley chilling how F'stupid people are here in southern NC compared to the rest of the country.
Rankings for Laurinburg in North Carolina


Locations Around Laurinburg
Map Of Laurinburg, NC
Best Places Around Laurinburg
Pinehurst, NC
Population 17,992
Fayetteville, NC
Population 209,692
Hope Mills, NC
Population 17,823
Southern Pines, NC
Population 16,052
Florence, SC
Population 40,205
Aberdeen, NC
Population 8,969
Hartsville, SC
Population 7,422
Bennettsville, SC
Population 6,798
Lumberton, NC
Population 19,220
Laurinburg Demographics And Statistics
Population over time in Laurinburg
The current population in Laurinburg is 15,079. The population has decreased -6.1% from 2010.
| Year | Population | % Change |
|---|---|---|
| 2023 | 15,079 | 0.7% |
| 2022 | 14,971 | -1.8% |
| 2021 | 15,242 | 0.8% |
| 2020 | 15,118 | -0.0% |
| 2019 | 15,119 | -0.9% |
| 2018 | 15,253 | -0.4% |
| 2017 | 15,320 | -1.8% |
| 2016 | 15,601 | -0.6% |
| 2015 | 15,694 | -0.7% |
| 2014 | 15,799 | -0.7% |
| 2013 | 15,909 | -0.4% |
| 2012 | 15,965 | -0.2% |
| 2011 | 16,004 | -0.4% |
| 2010 | 16,067 | - |
Race / Ethnicity in Laurinburg
Laurinburg is:
33.2% White with 5,000 White residents.
48.0% African American with 7,238 African American residents.
7.4% American Indian with 1,116 American Indian residents.
2.3% Asian with 340 Asian residents.
0.0% Hawaiian with 0 Hawaiian residents.
0.8% Other with 118 Other residents.
4.3% Two Or More with 641 Two Or More residents.
4.2% Hispanic with 626 Hispanic residents.
| Race | Laurinburg | NC | USA |
|---|---|---|---|
| White | 33.2% | 60.6% | 58.2% |
| African American | 48.0% | 20.3% | 12.0% |
| American Indian | 7.4% | 0.8% | 0.5% |
| Asian | 2.3% | 3.1% | 5.7% |
| Hawaiian | 0.0% | 0.1% | 0.2% |
| Other | 0.8% | 0.4% | 0.5% |
| Two Or More | 4.3% | 3.7% | 3.9% |
| Hispanic | 4.2% | 10.9% | 19.0% |
Gender in Laurinburg
Laurinburg is 51.3% female with 7,728 female residents.
Laurinburg is 48.7% male with 7,350 male residents.
| Gender | Laurinburg | NC | USA |
|---|---|---|---|
| Female | 51.3% | 51.1% | 50.5% |
| Male | 48.7% | 48.9% | 49.5% |
Highest level of educational attainment in Laurinburg for adults over 25
2.0% of adults in Laurinburg completed < 9th grade.
13.0% of adults in Laurinburg completed 9-12th grade.
36.0% of adults in Laurinburg completed high school / ged.
19.0% of adults in Laurinburg completed some college.
10.0% of adults in Laurinburg completed associate's degree.
12.0% of adults in Laurinburg completed bachelor's degree.
6.0% of adults in Laurinburg completed master's degree.
1.0% of adults in Laurinburg completed professional degree.
1.0% of adults in Laurinburg completed doctorate degree.
| Education | Laurinburg | NC | USA |
|---|---|---|---|
| < 9th Grade | 2.0% | 4.0% | 5.0% |
| 9-12th Grade | 13.0% | 6.0% | 6.0% |
| High School / GED | 36.0% | 25.0% | 26.0% |
| Some College | 19.0% | 20.0% | 19.0% |
| Associate's Degree | 10.0% | 10.0% | 9.0% |
| Bachelor's Degree | 12.0% | 22.0% | 21.0% |
| Master's Degree | 6.0% | 9.0% | 10.0% |
| Professional Degree | 1.0% | 2.0% | 2.0% |
| Doctorate Degree | 1.0% | 2.0% | 2.0% |
Household Income For Laurinburg, North Carolina
10.5% of households in Laurinburg earn Less than $10,000.
9.5% of households in Laurinburg earn $10,000 to $14,999.
16.3% of households in Laurinburg earn $15,000 to $24,999.
9.3% of households in Laurinburg earn $25,000 to $34,999.
12.3% of households in Laurinburg earn $35,000 to $49,999.
15.0% of households in Laurinburg earn $50,000 to $74,999.
12.0% of households in Laurinburg earn $75,000 to $99,999.
8.3% of households in Laurinburg earn $100,000 to $149,999.
2.0% of households in Laurinburg earn $150,000 to $199,999.
4.7% of households in Laurinburg earn $200,000 or more.
| Income | Laurinburg | NC | USA |
|---|---|---|---|
| Less than $10,000 | 10.5% | 5.0% | 4.9% |
| $10,000 to $14,999 | 9.5% | 3.9% | 3.6% |
| $15,000 to $24,999 | 16.3% | 7.6% | 6.6% |
| $25,000 to $34,999 | 9.3% | 7.8% | 6.8% |
| $35,000 to $49,999 | 12.3% | 12.0% | 10.4% |
| $50,000 to $74,999 | 15.0% | 17.0% | 15.7% |
| $75,000 to $99,999 | 12.0% | 13.0% | 12.7% |
| $100,000 to $149,999 | 8.3% | 16.5% | 17.4% |
| $150,000 to $199,999 | 2.0% | 7.8% | 9.3% |
| $200,000 or more | 4.7% | 9.5% | 12.6% |


