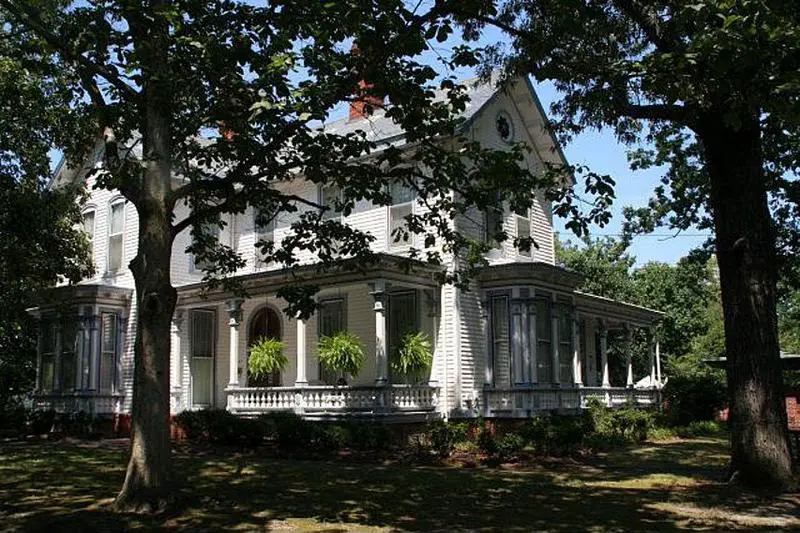
Tarboro, NC
Demographics And Statistics
Living In Tarboro, North Carolina Summary
Life in Tarboro research summary. HomeSnacks has been using Saturday Night Science to research the quality of life in Tarboro over the past nine years using Census, FBI, Zillow, and other primary data sources. Based on the most recently available data, we found the following about life in Tarboro:
The population in Tarboro is 10,705.
The median home value in Tarboro is $157,720.
The median income in Tarboro is $49,386.
The cost of living in Tarboro is 88 which is 0.9x lower than the national average.
The median rent in Tarboro is $698.
The unemployment rate in Tarboro is 2.3%.
The poverty rate in Tarboro is 19.8%.
The average high in Tarboro is 71.8° and the average low is 49.2°.
Table Of Contents
Tarboro SnackAbility
Overall SnackAbility
Tarboro, NC Cost Of Living
Cost of living in Tarboro summary. We use data on the cost of living to determine how expensive it is to live in Tarboro. Real estate prices drive most of the variance in cost of living around North Carolina. Key points include:
The cost of living in Tarboro is 88 with 100 being average.
The cost of living in Tarboro is 0.9x lower than the national average.
The median home value in Tarboro is $157,720.
The median income in Tarboro is $49,386.
Tarboro's Overall Cost Of Living
Lower Than The National Average
Cost Of Living In Tarboro Comparison Table
| Living Expense | Tarboro | North Carolina | National Average | |
|---|---|---|---|---|
| Overall | 88 | 92 | 100 | |
| Services | 97 | 100 | 100 | |
| Groceries | 99 | 99 | 100 | |
| Health | 110 | 106 | 100 | |
| Housing | 73 | 86 | 100 | |
| Transportation | 95 | 93 | 100 | |
| Utilities | 98 | 95 | 100 | |
Tarboro, NC Weather
The average high in Tarboro is 71.8° and the average low is 49.2°.
There are 76.6 days of precipitation each year.
Expect an average of 45.4 inches of precipitation each year with 4.6 inches of snow.
| Stat | Tarboro |
|---|---|
| Average Annual High | 71.8 |
| Average Annual Low | 49.2 |
| Annual Precipitation Days | 76.6 |
| Average Annual Precipitation | 45.4 |
| Average Annual Snowfall | 4.6 |
Average High
Days of Rain
Tarboro, NC Photos
1 Reviews & Comments About Tarboro
/5

Paschasia Basemore - None
I live in North Carolina and in Tarboro and Tarboro looks nothing like that today the worst city to live in Rocky Mount where the crime rate is extremely high y'all fail to mention that
Rankings for Tarboro in North Carolina


Locations Around Tarboro
Map Of Tarboro, NC
Best Places Around Tarboro
Winterville, NC
Population 10,624
Wendell, NC
Population 11,585
Greenville, NC
Population 88,540
Nashville, NC
Population 5,672
Roanoke Rapids, NC
Population 15,024
Washington, NC
Population 9,754
Wilson, NC
Population 47,740
Williamston, NC
Population 5,157
Rocky Mount, NC
Population 54,175
Selma, NC
Population 6,611
Tarboro Demographics And Statistics
Population over time in Tarboro
The current population in Tarboro is 10,705. The population has decreased -6.3% from 2010.
| Year | Population | % Change |
|---|---|---|
| 2023 | 10,705 | 0.1% |
| 2022 | 10,696 | -0.3% |
| 2021 | 10,733 | -0.7% |
| 2020 | 10,806 | -1.0% |
| 2019 | 10,915 | -1.2% |
| 2018 | 11,045 | 0.1% |
| 2017 | 11,038 | -1.5% |
| 2016 | 11,206 | -0.8% |
| 2015 | 11,292 | -0.3% |
| 2014 | 11,323 | -0.5% |
| 2013 | 11,375 | -0.2% |
| 2012 | 11,401 | 0.1% |
| 2011 | 11,390 | -0.3% |
| 2010 | 11,424 | - |
Race / Ethnicity in Tarboro
Tarboro is:
39.1% White with 4,186 White residents.
51.7% African American with 5,532 African American residents.
0.0% American Indian with 5 American Indian residents.
0.0% Asian with 1 Asian residents.
0.0% Hawaiian with 5 Hawaiian residents.
0.2% Other with 25 Other residents.
1.4% Two Or More with 154 Two Or More residents.
7.4% Hispanic with 797 Hispanic residents.
| Race | Tarboro | NC | USA |
|---|---|---|---|
| White | 39.1% | 60.6% | 58.2% |
| African American | 51.7% | 20.3% | 12.0% |
| American Indian | 0.0% | 0.8% | 0.5% |
| Asian | 0.0% | 3.1% | 5.7% |
| Hawaiian | 0.0% | 0.1% | 0.2% |
| Other | 0.2% | 0.4% | 0.5% |
| Two Or More | 1.4% | 3.7% | 3.9% |
| Hispanic | 7.4% | 10.9% | 19.0% |
Gender in Tarboro
Tarboro is 57.3% female with 6,136 female residents.
Tarboro is 42.7% male with 4,569 male residents.
| Gender | Tarboro | NC | USA |
|---|---|---|---|
| Female | 57.3% | 51.1% | 50.5% |
| Male | 42.7% | 48.9% | 49.5% |
Highest level of educational attainment in Tarboro for adults over 25
4.0% of adults in Tarboro completed < 9th grade.
8.0% of adults in Tarboro completed 9-12th grade.
35.0% of adults in Tarboro completed high school / ged.
23.0% of adults in Tarboro completed some college.
5.0% of adults in Tarboro completed associate's degree.
17.0% of adults in Tarboro completed bachelor's degree.
6.0% of adults in Tarboro completed master's degree.
2.0% of adults in Tarboro completed professional degree.
0.0% of adults in Tarboro completed doctorate degree.
| Education | Tarboro | NC | USA |
|---|---|---|---|
| < 9th Grade | 4.0% | 4.0% | 5.0% |
| 9-12th Grade | 8.0% | 6.0% | 6.0% |
| High School / GED | 35.0% | 25.0% | 26.0% |
| Some College | 23.0% | 20.0% | 19.0% |
| Associate's Degree | 5.0% | 10.0% | 9.0% |
| Bachelor's Degree | 17.0% | 22.0% | 21.0% |
| Master's Degree | 6.0% | 9.0% | 10.0% |
| Professional Degree | 2.0% | 2.0% | 2.0% |
| Doctorate Degree | 0.0% | 2.0% | 2.0% |
Household Income For Tarboro, North Carolina
7.2% of households in Tarboro earn Less than $10,000.
6.5% of households in Tarboro earn $10,000 to $14,999.
20.6% of households in Tarboro earn $15,000 to $24,999.
8.6% of households in Tarboro earn $25,000 to $34,999.
7.4% of households in Tarboro earn $35,000 to $49,999.
12.6% of households in Tarboro earn $50,000 to $74,999.
11.9% of households in Tarboro earn $75,000 to $99,999.
11.7% of households in Tarboro earn $100,000 to $149,999.
8.4% of households in Tarboro earn $150,000 to $199,999.
5.2% of households in Tarboro earn $200,000 or more.
| Income | Tarboro | NC | USA |
|---|---|---|---|
| Less than $10,000 | 7.2% | 5.0% | 4.9% |
| $10,000 to $14,999 | 6.5% | 3.9% | 3.6% |
| $15,000 to $24,999 | 20.6% | 7.6% | 6.6% |
| $25,000 to $34,999 | 8.6% | 7.8% | 6.8% |
| $35,000 to $49,999 | 7.4% | 12.0% | 10.4% |
| $50,000 to $74,999 | 12.6% | 17.0% | 15.7% |
| $75,000 to $99,999 | 11.9% | 13.0% | 12.7% |
| $100,000 to $149,999 | 11.7% | 16.5% | 17.4% |
| $150,000 to $199,999 | 8.4% | 7.8% | 9.3% |
| $200,000 or more | 5.2% | 9.5% | 12.6% |


