Fallon, NV
Demographics And Statistics
Living In Fallon, Nevada Summary
Life in Fallon research summary. HomeSnacks has been using Saturday Night Science to research the quality of life in Fallon over the past nine years using Census, FBI, Zillow, and other primary data sources. Based on the most recently available data, we found the following about life in Fallon:
The population in Fallon is 9,371.
The median home value in Fallon is $382,269.
The median income in Fallon is $65,699.
The cost of living in Fallon is 102 which is 1.0x higher than the national average.
The median rent in Fallon is $1,194.
The unemployment rate in Fallon is 4.8%.
The poverty rate in Fallon is 13.0%.
The average high in Fallon is 68.3° and the average low is 37.5°.
Fallon SnackAbility
Overall SnackAbility
Fallon, NV Crime Report
Crime in Fallon summary. We use data from the FBI to determine the crime rates in Fallon. Key points include:
There were 131 total crimes in Fallon in the last reporting year.
The overall crime rate per 100,000 people in Fallon is 1,356.0 / 100k people.
The violent crime rate per 100,000 people in Fallon is 207.0 / 100k people.
The property crime rate per 100,000 people in Fallon is 1,148.9 / 100k people.
Overall, crime in Fallon is -36.02% below the national average.
Total Crimes
Below National Average
Crime In Fallon Comparison Table
| Statistic | Count Raw |
Fallon / 100k People |
Nevada / 100k People |
National / 100k People |
|---|---|---|---|---|
| Total Crimes Per 100K | 131 | 1,356.0 | 2,599.0 | 2,119.2 |
| Violent Crime | 20 | 207.0 | 402.0 | 359.0 |
| Murder | 0 | 0.0 | 6.1 | 5.0 |
| Robbery | 1 | 10.4 | 63.1 | 61.0 |
| Aggravated Assault | 19 | 196.7 | 281.0 | 256.0 |
| Property Crime | 111 | 1,148.9 | 2,197.0 | 1,760.0 |
| Burglary | 5 | 51.8 | 364.4 | 229.0 |
| Larceny | 99 | 1,024.7 | 1,357.2 | 1,272.0 |
| Car Theft | 7 | 72.5 | 475.4 | 259.0 |
Fallon, NV Cost Of Living
Cost of living in Fallon summary. We use data on the cost of living to determine how expensive it is to live in Fallon. Real estate prices drive most of the variance in cost of living around Nevada. Key points include:
The cost of living in Fallon is 102 with 100 being average.
The cost of living in Fallon is 1.0x higher than the national average.
The median home value in Fallon is $382,269.
The median income in Fallon is $65,699.
Fallon's Overall Cost Of Living
Higher Than The National Average
Cost Of Living In Fallon Comparison Table
| Living Expense | Fallon | Nevada | National Average | |
|---|---|---|---|---|
| Overall | 102 | 101 | 100 | |
| Services | 100 | 93 | 100 | |
| Groceries | 100 | 104 | 100 | |
| Health | 94 | 94 | 100 | |
| Housing | 101 | 105 | 100 | |
| Transportation | 120 | 118 | 100 | |
| Utilities | 91 | 101 | 100 | |
Fallon, NV Weather
The average high in Fallon is 68.3° and the average low is 37.5°.
There are 15.3 days of precipitation each year.
Expect an average of 4.7 inches of precipitation each year with 7.2 inches of snow.
| Stat | Fallon |
|---|---|
| Average Annual High | 68.3 |
| Average Annual Low | 37.5 |
| Annual Precipitation Days | 15.3 |
| Average Annual Precipitation | 4.7 |
| Average Annual Snowfall | 7.2 |
Average High
Days of Rain
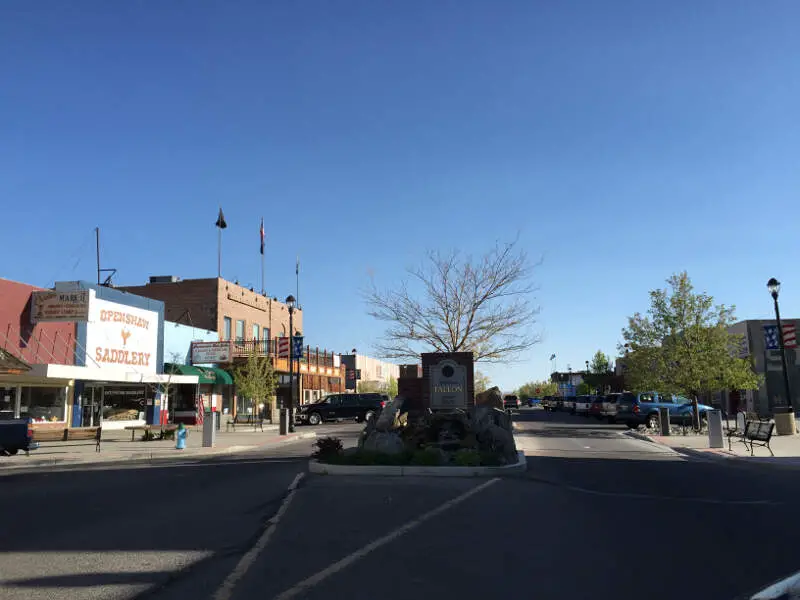
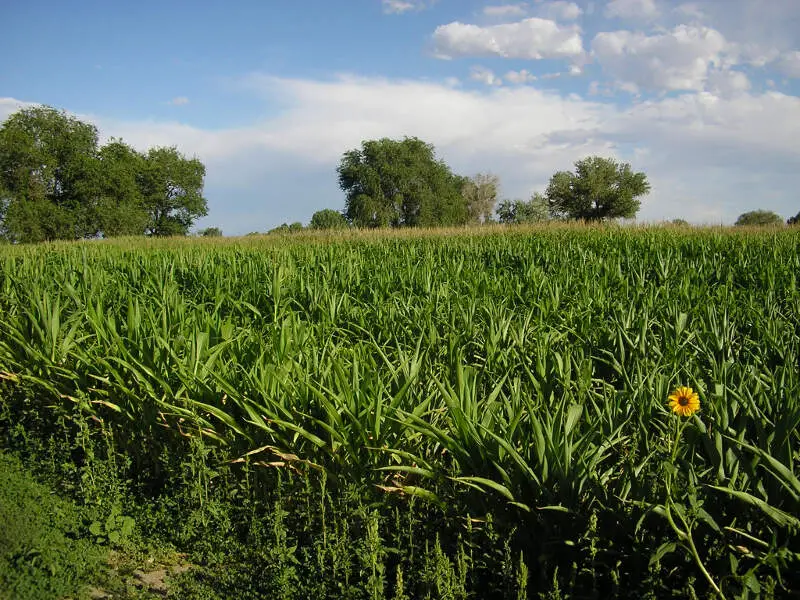
Fallon, NV Photos

1 Reviews & Comments About Fallon
/5

HomeSnacks User - 2019-05-06 18:23:25
I visited fallon nv. The dog groomer strongly led me to believe they do not want out of state residents moving into their litle piece of heaven... later i visited yerrington and will never ever go back. Females hate other females because their man might cheat i hear. Scary scary nightmare... Beautiful country though...worth the visit so pretty!
Lakes.. mountain hikes...red rock...fishing spots...casinos...all u can eat sushi.
Rankings for Fallon in Nevada


Locations Around Fallon
Map Of Fallon, NV
Best Places Around Fallon
Spanish Springs, NV
Population 17,512
Dayton, NV
Population 15,873
Sparks, NV
Population 109,106
Fernley, NV
Population 23,631
Silver Springs, NV
Population 5,523
Yerington, NV
Population 3,139
Fallon Demographics And Statistics
Population over time in Fallon
The current population in Fallon is 9,371. The population has increased 9.5% from 2010.
| Year | Population | % Change |
|---|---|---|
| 2023 | 9,371 | 1.4% |
| 2022 | 9,243 | 1.9% |
| 2021 | 9,068 | 6.2% |
| 2020 | 8,540 | 1.3% |
| 2019 | 8,430 | 1.2% |
| 2018 | 8,330 | 0.1% |
| 2017 | 8,325 | -1.0% |
| 2016 | 8,410 | -0.4% |
| 2015 | 8,442 | -0.1% |
| 2014 | 8,451 | -0.9% |
| 2013 | 8,527 | -0.3% |
| 2012 | 8,555 | -0.2% |
| 2011 | 8,570 | 0.1% |
| 2010 | 8,560 | - |
Race / Ethnicity in Fallon
Fallon is:
72.4% White with 6,785 White residents.
3.2% African American with 300 African American residents.
0.8% American Indian with 78 American Indian residents.
1.8% Asian with 170 Asian residents.
0.2% Hawaiian with 17 Hawaiian residents.
0.3% Other with 32 Other residents.
7.6% Two Or More with 709 Two Or More residents.
13.7% Hispanic with 1,280 Hispanic residents.
| Race | Fallon | NV | USA |
|---|---|---|---|
| White | 72.4% | 46.0% | 58.2% |
| African American | 3.2% | 9.1% | 12.0% |
| American Indian | 0.8% | 0.6% | 0.5% |
| Asian | 1.8% | 8.5% | 5.7% |
| Hawaiian | 0.2% | 0.7% | 0.2% |
| Other | 0.3% | 0.5% | 0.5% |
| Two Or More | 7.6% | 5.4% | 3.9% |
| Hispanic | 13.7% | 29.2% | 19.0% |
Gender in Fallon
Fallon is 47.3% female with 4,434 female residents.
Fallon is 52.7% male with 4,937 male residents.
| Gender | Fallon | NV | USA |
|---|---|---|---|
| Female | 47.3% | 49.6% | 50.5% |
| Male | 52.7% | 50.4% | 49.5% |
Highest level of educational attainment in Fallon for adults over 25
2.0% of adults in Fallon completed < 9th grade.
6.0% of adults in Fallon completed 9-12th grade.
35.0% of adults in Fallon completed high school / ged.
33.0% of adults in Fallon completed some college.
8.0% of adults in Fallon completed associate's degree.
11.0% of adults in Fallon completed bachelor's degree.
4.0% of adults in Fallon completed master's degree.
1.0% of adults in Fallon completed professional degree.
0.0% of adults in Fallon completed doctorate degree.
| Education | Fallon | NV | USA |
|---|---|---|---|
| < 9th Grade | 2.0% | 5.0% | 5.0% |
| 9-12th Grade | 6.0% | 7.0% | 6.0% |
| High School / GED | 35.0% | 27.0% | 26.0% |
| Some College | 33.0% | 24.0% | 19.0% |
| Associate's Degree | 8.0% | 9.0% | 9.0% |
| Bachelor's Degree | 11.0% | 18.0% | 21.0% |
| Master's Degree | 4.0% | 7.0% | 10.0% |
| Professional Degree | 1.0% | 2.0% | 2.0% |
| Doctorate Degree | 0.0% | 1.0% | 2.0% |
Household Income For Fallon, Nevada
6.3% of households in Fallon earn Less than $10,000.
2.1% of households in Fallon earn $10,000 to $14,999.
6.3% of households in Fallon earn $15,000 to $24,999.
7.3% of households in Fallon earn $25,000 to $34,999.
14.3% of households in Fallon earn $35,000 to $49,999.
20.8% of households in Fallon earn $50,000 to $74,999.
16.3% of households in Fallon earn $75,000 to $99,999.
16.0% of households in Fallon earn $100,000 to $149,999.
3.7% of households in Fallon earn $150,000 to $199,999.
6.8% of households in Fallon earn $200,000 or more.
| Income | Fallon | NV | USA |
|---|---|---|---|
| Less than $10,000 | 6.3% | 5.2% | 4.9% |
| $10,000 to $14,999 | 2.1% | 2.9% | 3.6% |
| $15,000 to $24,999 | 6.3% | 6.3% | 6.6% |
| $25,000 to $34,999 | 7.3% | 7.1% | 6.8% |
| $35,000 to $49,999 | 14.3% | 11.1% | 10.4% |
| $50,000 to $74,999 | 20.8% | 17.0% | 15.7% |
| $75,000 to $99,999 | 16.3% | 13.6% | 12.7% |
| $100,000 to $149,999 | 16.0% | 18.1% | 17.4% |
| $150,000 to $199,999 | 3.7% | 8.8% | 9.3% |
| $200,000 or more | 6.8% | 9.8% | 12.6% |


