Fernley, NV
Demographics And Statistics
Living In Fernley, Nevada Summary
Life in Fernley research summary. HomeSnacks has been using Saturday Night Science to research the quality of life in Fernley over the past nine years using Census, FBI, Zillow, and other primary data sources. Based on the most recently available data, we found the following about life in Fernley:
The population in Fernley is 23,631.
The median home value in Fernley is $389,977.
The median income in Fernley is $87,991.
The cost of living in Fernley is 111 which is 1.1x higher than the national average.
The median rent in Fernley is $1,463.
The unemployment rate in Fernley is 4.4%.
The poverty rate in Fernley is 11.3%.
The average high in Fernley is 67.9° and the average low is 38.4°.
Table Of Contents
Fernley SnackAbility
Overall SnackAbility
Fernley, NV Cost Of Living
Cost of living in Fernley summary. We use data on the cost of living to determine how expensive it is to live in Fernley. Real estate prices drive most of the variance in cost of living around Nevada. Key points include:
The cost of living in Fernley is 111 with 100 being average.
The cost of living in Fernley is 1.1x higher than the national average.
The median home value in Fernley is $389,977.
The median income in Fernley is $87,991.
Fernley's Overall Cost Of Living
Higher Than The National Average
Cost Of Living In Fernley Comparison Table
| Living Expense | Fernley | Nevada | National Average | |
|---|---|---|---|---|
| Overall | 111 | 101 | 100 | |
| Services | 98 | 93 | 100 | |
| Groceries | 100 | 104 | 100 | |
| Health | 96 | 94 | 100 | |
| Housing | 135 | 105 | 100 | |
| Transportation | 123 | 118 | 100 | |
| Utilities | 93 | 101 | 100 | |
Fernley, NV Weather
The average high in Fernley is 67.9° and the average low is 38.4°.
There are 16.7 days of precipitation each year.
Expect an average of 5.2 inches of precipitation each year with 20.8 inches of snow.
| Stat | Fernley |
|---|---|
| Average Annual High | 67.9 |
| Average Annual Low | 38.4 |
| Annual Precipitation Days | 16.7 |
| Average Annual Precipitation | 5.2 |
| Average Annual Snowfall | 20.8 |
Average High
Days of Rain
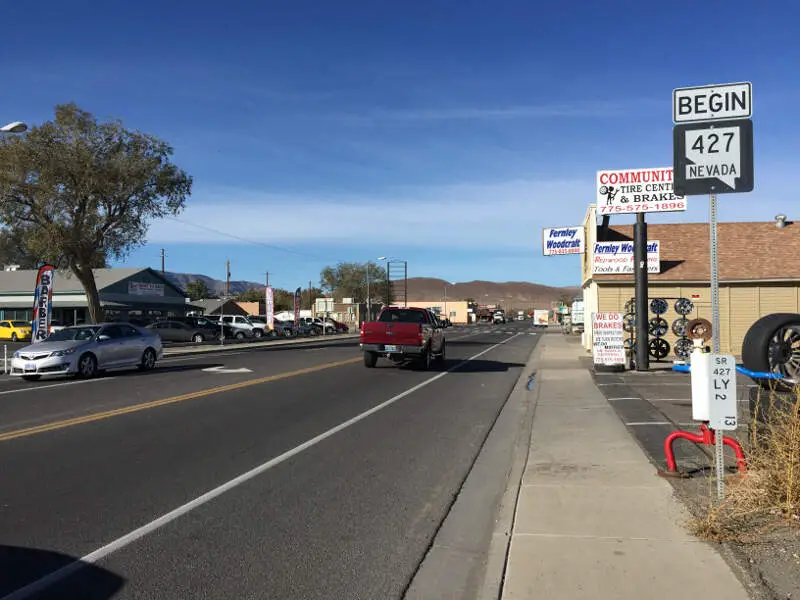
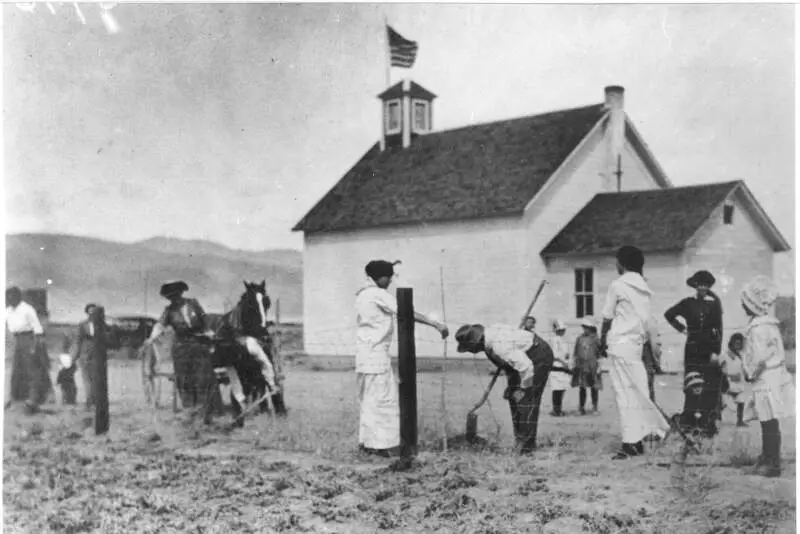
Fernley, NV Photos
Rankings for Fernley in Nevada


Locations Around Fernley
Map Of Fernley, NV
Best Places Around Fernley
Johnson Lane, NV
Population 6,405
Spanish Springs, NV
Population 17,512
Cold Springs, NV
Population 11,223
Lemmon Valley, NV
Population 4,385
Fallon, NV
Population 9,371
Indian Hills, NV
Population 5,772
Dayton, NV
Population 15,873
Fernley Demographics And Statistics
Population over time in Fernley
The current population in Fernley is 23,631. The population has increased 28.6% from 2010.
| Year | Population | % Change |
|---|---|---|
| 2023 | 23,631 | 2.6% |
| 2022 | 23,035 | 3.1% |
| 2021 | 22,343 | 8.4% |
| 2020 | 20,616 | 2.7% |
| 2019 | 20,068 | 2.5% |
| 2018 | 19,573 | 1.6% |
| 2017 | 19,261 | 0.2% |
| 2016 | 19,228 | 0.2% |
| 2015 | 19,185 | 0.0% |
| 2014 | 19,184 | -0.0% |
| 2013 | 19,185 | 0.6% |
| 2012 | 19,074 | 1.0% |
| 2011 | 18,886 | 2.8% |
| 2010 | 18,378 | - |
Race / Ethnicity in Fernley
Fernley is:
68.8% White with 16,269 White residents.
1.3% African American with 296 African American residents.
1.2% American Indian with 274 American Indian residents.
1.7% Asian with 404 Asian residents.
0.3% Hawaiian with 64 Hawaiian residents.
0.3% Other with 82 Other residents.
7.3% Two Or More with 1,723 Two Or More residents.
19.1% Hispanic with 4,519 Hispanic residents.
| Race | Fernley | NV | USA |
|---|---|---|---|
| White | 68.8% | 46.0% | 58.2% |
| African American | 1.3% | 9.1% | 12.0% |
| American Indian | 1.2% | 0.6% | 0.5% |
| Asian | 1.7% | 8.5% | 5.7% |
| Hawaiian | 0.3% | 0.7% | 0.2% |
| Other | 0.3% | 0.5% | 0.5% |
| Two Or More | 7.3% | 5.4% | 3.9% |
| Hispanic | 19.1% | 29.2% | 19.0% |
Gender in Fernley
Fernley is 49.1% female with 11,613 female residents.
Fernley is 50.9% male with 12,018 male residents.
| Gender | Fernley | NV | USA |
|---|---|---|---|
| Female | 49.1% | 49.6% | 50.5% |
| Male | 50.9% | 50.4% | 49.5% |
Highest level of educational attainment in Fernley for adults over 25
3.0% of adults in Fernley completed < 9th grade.
7.0% of adults in Fernley completed 9-12th grade.
36.0% of adults in Fernley completed high school / ged.
29.0% of adults in Fernley completed some college.
10.0% of adults in Fernley completed associate's degree.
11.0% of adults in Fernley completed bachelor's degree.
3.0% of adults in Fernley completed master's degree.
0.0% of adults in Fernley completed professional degree.
1.0% of adults in Fernley completed doctorate degree.
| Education | Fernley | NV | USA |
|---|---|---|---|
| < 9th Grade | 3.0% | 5.0% | 5.0% |
| 9-12th Grade | 7.0% | 7.0% | 6.0% |
| High School / GED | 36.0% | 27.0% | 26.0% |
| Some College | 29.0% | 24.0% | 19.0% |
| Associate's Degree | 10.0% | 9.0% | 9.0% |
| Bachelor's Degree | 11.0% | 18.0% | 21.0% |
| Master's Degree | 3.0% | 7.0% | 10.0% |
| Professional Degree | 0.0% | 2.0% | 2.0% |
| Doctorate Degree | 1.0% | 1.0% | 2.0% |
Household Income For Fernley, Nevada
4.4% of households in Fernley earn Less than $10,000.
2.5% of households in Fernley earn $10,000 to $14,999.
4.0% of households in Fernley earn $15,000 to $24,999.
3.0% of households in Fernley earn $25,000 to $34,999.
10.8% of households in Fernley earn $35,000 to $49,999.
20.0% of households in Fernley earn $50,000 to $74,999.
12.9% of households in Fernley earn $75,000 to $99,999.
24.7% of households in Fernley earn $100,000 to $149,999.
10.7% of households in Fernley earn $150,000 to $199,999.
7.0% of households in Fernley earn $200,000 or more.
| Income | Fernley | NV | USA |
|---|---|---|---|
| Less than $10,000 | 4.4% | 5.2% | 4.9% |
| $10,000 to $14,999 | 2.5% | 2.9% | 3.6% |
| $15,000 to $24,999 | 4.0% | 6.3% | 6.6% |
| $25,000 to $34,999 | 3.0% | 7.1% | 6.8% |
| $35,000 to $49,999 | 10.8% | 11.1% | 10.4% |
| $50,000 to $74,999 | 20.0% | 17.0% | 15.7% |
| $75,000 to $99,999 | 12.9% | 13.6% | 12.7% |
| $100,000 to $149,999 | 24.7% | 18.1% | 17.4% |
| $150,000 to $199,999 | 10.7% | 8.8% | 9.3% |
| $200,000 or more | 7.0% | 9.8% | 12.6% |


