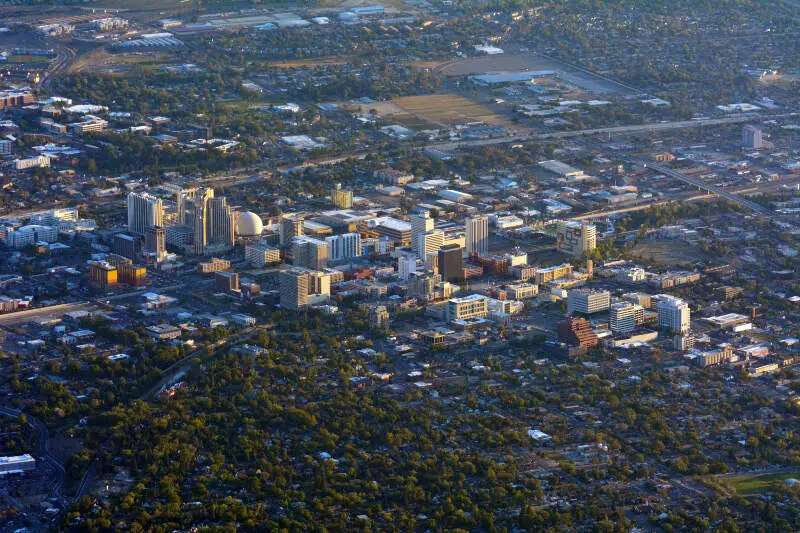
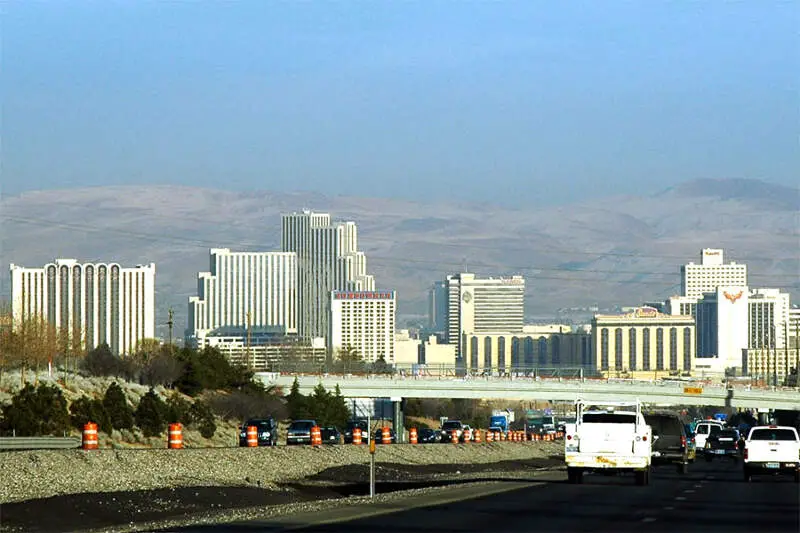
Reno, NV
Demographics And Statistics
Living In Reno, Nevada Summary
Life in Reno research summary. HomeSnacks has been using Saturday Night Science to research the quality of life in Reno over the past nine years using Census, FBI, Zillow, and other primary data sources. Based on the most recently available data, we found the following about life in Reno:
The population in Reno is 268,959.
The median home value in Reno is $558,136.
The median income in Reno is $78,448.
The cost of living in Reno is 121 which is 1.2x higher than the national average.
The median rent in Reno is $1,453.
The unemployment rate in Reno is 5.0%.
The poverty rate in Reno is 12.5%.
The average high in Reno is 66.0° and the average low is 37.1°.
Reno SnackAbility
Overall SnackAbility
Reno, NV Crime Report
Crime in Reno summary. We use data from the FBI to determine the crime rates in Reno. Key points include:
There were 8,279 total crimes in Reno in the last reporting year.
The overall crime rate per 100,000 people in Reno is 2,974.7 / 100k people.
The violent crime rate per 100,000 people in Reno is 529.6 / 100k people.
The property crime rate per 100,000 people in Reno is 2,445.1 / 100k people.
Overall, crime in Reno is 40.37% above the national average.
Total Crimes
Above National Average
Crime In Reno Comparison Table
| Statistic | Count Raw |
Reno / 100k People |
Nevada / 100k People |
National / 100k People |
|---|---|---|---|---|
| Total Crimes Per 100K | 8,279 | 2,974.7 | 2,599.0 | 2,119.2 |
| Violent Crime | 1,474 | 529.6 | 402.0 | 359.0 |
| Murder | 23 | 8.3 | 6.1 | 5.0 |
| Robbery | 263 | 94.5 | 63.1 | 61.0 |
| Aggravated Assault | 996 | 357.9 | 281.0 | 256.0 |
| Property Crime | 6,805 | 2,445.1 | 2,197.0 | 1,760.0 |
| Burglary | 869 | 312.2 | 364.4 | 229.0 |
| Larceny | 4,967 | 1,784.7 | 1,357.2 | 1,272.0 |
| Car Theft | 969 | 348.2 | 475.4 | 259.0 |
Reno, NV Cost Of Living
Cost of living in Reno summary. We use data on the cost of living to determine how expensive it is to live in Reno. Real estate prices drive most of the variance in cost of living around Nevada. Key points include:
The cost of living in Reno is 121 with 100 being average.
The cost of living in Reno is 1.2x higher than the national average.
The median home value in Reno is $558,136.
The median income in Reno is $78,448.
Reno's Overall Cost Of Living
Higher Than The National Average
Cost Of Living In Reno Comparison Table
| Living Expense | Reno | Nevada | National Average | |
|---|---|---|---|---|
| Overall | 121 | 101 | 100 | |
| Services | 101 | 93 | 100 | |
| Groceries | 103 | 104 | 100 | |
| Health | 94 | 94 | 100 | |
| Housing | 174 | 105 | 100 | |
| Transportation | 122 | 118 | 100 | |
| Utilities | 92 | 101 | 100 | |
Reno, NV Weather
The average high in Reno is 66.0° and the average low is 37.1°.
There are 22.1 days of precipitation each year.
Expect an average of 10.1 inches of precipitation each year with 22.3 inches of snow.
| Stat | Reno |
|---|---|
| Average Annual High | 66.0 |
| Average Annual Low | 37.1 |
| Annual Precipitation Days | 22.1 |
| Average Annual Precipitation | 10.1 |
| Average Annual Snowfall | 22.3 |
Average High
Days of Rain
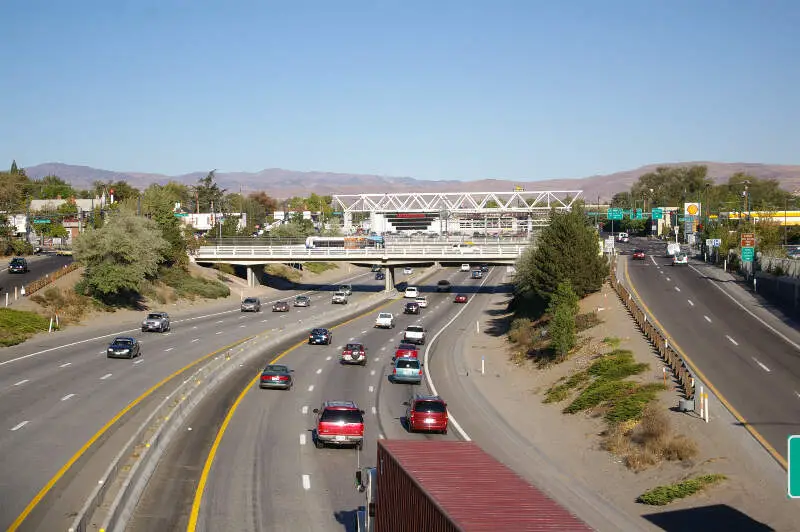
Reno, NV Photos


2 Reviews & Comments About Reno
/5

HomeSnacks User - 2018-08-04 01:02:14.368270
Loads of schools both public and private, with more in the works. Big events year-round, averaging one biggie per month, ranging from hot air balloon races, rodeo, air races, food fests, nearby Burning Man, parades for numerous reasons, a growing art scene,....there's just so much going on lately. Plus the casinos. All this and a decent sized river coursing downtown that hosts kayak contests. A construction boom is in progress.
Watch out for the poorly maintained roads, impatient tail riding drivers, and extreme temperatures; summer is very hot and winter is bone chilling cold with a lot of snow possible. Rain, hail, high winds, drought, avalanches flooding, wildfires, it has it all.
The sheer number of special events and stuff to do in a city this size is pretty amazing.
HomeSnacks User - 2018-08-20 18:38:21.720106
Literally one of the worst places I've ever been in my life.
A m**h-infested hellhole with gambling. Tattoo parlor on every corner. Crime seems pretty ridiculous. The weather is always terrible.
Rankings for Reno in Nevada


Locations Around Reno
Map Of Reno, NV
Best Places Around Reno
Spanish Springs, NV
Population 17,512
Cold Springs, NV
Population 11,223
Lemmon Valley, NV
Population 4,385
Sparks, NV
Population 109,106
Sun Valley, NV
Population 22,697
Reno Demographics And Statistics
Population over time in Reno
The current population in Reno is 268,959. The population has increased 21.7% from 2010.
| Year | Population | % Change |
|---|---|---|
| 2023 | 268,959 | 1.4% |
| 2022 | 265,196 | 2.0% |
| 2021 | 259,913 | 3.6% |
| 2020 | 250,903 | 1.8% |
| 2019 | 246,500 | 1.6% |
| 2018 | 242,633 | 1.2% |
| 2017 | 239,732 | 1.1% |
| 2016 | 237,121 | 1.3% |
| 2015 | 234,161 | 1.3% |
| 2014 | 231,103 | 1.2% |
| 2013 | 228,442 | 0.9% |
| 2012 | 226,305 | 1.2% |
| 2011 | 223,558 | 1.2% |
| 2010 | 220,996 | - |
Race / Ethnicity in Reno
Reno is:
58.3% White with 156,929 White residents.
3.1% African American with 8,339 African American residents.
0.6% American Indian with 1,643 American Indian residents.
6.9% Asian with 18,435 Asian residents.
0.7% Hawaiian with 1,839 Hawaiian residents.
0.5% Other with 1,366 Other residents.
5.3% Two Or More with 14,316 Two Or More residents.
24.6% Hispanic with 66,092 Hispanic residents.
| Race | Reno | NV | USA |
|---|---|---|---|
| White | 58.3% | 46.0% | 58.2% |
| African American | 3.1% | 9.1% | 12.0% |
| American Indian | 0.6% | 0.6% | 0.5% |
| Asian | 6.9% | 8.5% | 5.7% |
| Hawaiian | 0.7% | 0.7% | 0.2% |
| Other | 0.5% | 0.5% | 0.5% |
| Two Or More | 5.3% | 5.4% | 3.9% |
| Hispanic | 24.6% | 29.2% | 19.0% |
Gender in Reno
Reno is 49.3% female with 132,618 female residents.
Reno is 50.7% male with 136,341 male residents.
| Gender | Reno | NV | USA |
|---|---|---|---|
| Female | 49.3% | 49.6% | 50.5% |
| Male | 50.7% | 50.4% | 49.5% |
Highest level of educational attainment in Reno for adults over 25
5.0% of adults in Reno completed < 9th grade.
6.0% of adults in Reno completed 9-12th grade.
23.0% of adults in Reno completed high school / ged.
23.0% of adults in Reno completed some college.
8.0% of adults in Reno completed associate's degree.
21.0% of adults in Reno completed bachelor's degree.
9.0% of adults in Reno completed master's degree.
3.0% of adults in Reno completed professional degree.
2.0% of adults in Reno completed doctorate degree.
| Education | Reno | NV | USA |
|---|---|---|---|
| < 9th Grade | 5.0% | 5.0% | 5.0% |
| 9-12th Grade | 6.0% | 7.0% | 6.0% |
| High School / GED | 23.0% | 27.0% | 26.0% |
| Some College | 23.0% | 24.0% | 19.0% |
| Associate's Degree | 8.0% | 9.0% | 9.0% |
| Bachelor's Degree | 21.0% | 18.0% | 21.0% |
| Master's Degree | 9.0% | 7.0% | 10.0% |
| Professional Degree | 3.0% | 2.0% | 2.0% |
| Doctorate Degree | 2.0% | 1.0% | 2.0% |
Household Income For Reno, Nevada
4.8% of households in Reno earn Less than $10,000.
3.1% of households in Reno earn $10,000 to $14,999.
6.4% of households in Reno earn $15,000 to $24,999.
6.9% of households in Reno earn $25,000 to $34,999.
10.2% of households in Reno earn $35,000 to $49,999.
16.6% of households in Reno earn $50,000 to $74,999.
13.2% of households in Reno earn $75,000 to $99,999.
18.7% of households in Reno earn $100,000 to $149,999.
8.9% of households in Reno earn $150,000 to $199,999.
11.0% of households in Reno earn $200,000 or more.
| Income | Reno | NV | USA |
|---|---|---|---|
| Less than $10,000 | 4.8% | 5.2% | 4.9% |
| $10,000 to $14,999 | 3.1% | 2.9% | 3.6% |
| $15,000 to $24,999 | 6.4% | 6.3% | 6.6% |
| $25,000 to $34,999 | 6.9% | 7.1% | 6.8% |
| $35,000 to $49,999 | 10.2% | 11.1% | 10.4% |
| $50,000 to $74,999 | 16.6% | 17.0% | 15.7% |
| $75,000 to $99,999 | 13.2% | 13.6% | 12.7% |
| $100,000 to $149,999 | 18.7% | 18.1% | 17.4% |
| $150,000 to $199,999 | 8.9% | 8.8% | 9.3% |
| $200,000 or more | 11.0% | 9.8% | 12.6% |


