Milwaukie, OR
Demographics And Statistics
Living In Milwaukie, Oregon Summary
Life in Milwaukie research summary. HomeSnacks has been using Saturday Night Science to research the quality of life in Milwaukie over the past nine years using Census, FBI, Zillow, and other primary data sources. Based on the most recently available data, we found the following about life in Milwaukie:
The population in Milwaukie is 21,256.
The median home value in Milwaukie is $505,791.
The median income in Milwaukie is $82,422.
The cost of living in Milwaukie is 127 which is 1.3x higher than the national average.
The median rent in Milwaukie is $1,499.
The unemployment rate in Milwaukie is 6.0%.
The poverty rate in Milwaukie is 6.5%.
The average high in Milwaukie is 63.2° and the average low is 44.6°.
Milwaukie SnackAbility
Overall SnackAbility
Milwaukie, OR Crime Report
Crime in Milwaukie summary. We use data from the FBI to determine the crime rates in Milwaukie. Key points include:
There were 374 total crimes in Milwaukie in the last reporting year.
The overall crime rate per 100,000 people in Milwaukie is 1,719.9 / 100k people.
The violent crime rate per 100,000 people in Milwaukie is 193.1 / 100k people.
The property crime rate per 100,000 people in Milwaukie is 1,526.8 / 100k people.
Overall, crime in Milwaukie is -18.84% below the national average.
Total Crimes
Below National Average
Crime In Milwaukie Comparison Table
| Statistic | Count Raw |
Milwaukie / 100k People |
Oregon / 100k People |
National / 100k People |
|---|---|---|---|---|
| Total Crimes Per 100K | 374 | 1,719.9 | 2,719.1 | 2,119.2 |
| Violent Crime | 42 | 193.1 | 331.0 | 359.0 |
| Murder | 0 | 0.0 | 3.7 | 5.0 |
| Robbery | 3 | 13.8 | 57.0 | 61.0 |
| Aggravated Assault | 29 | 133.4 | 229.1 | 256.0 |
| Property Crime | 332 | 1,526.8 | 2,388.0 | 1,760.0 |
| Burglary | 34 | 156.4 | 306.5 | 229.0 |
| Larceny | 245 | 1,126.7 | 1,789.5 | 1,272.0 |
| Car Theft | 53 | 243.7 | 292.1 | 259.0 |
Milwaukie, OR Cost Of Living
Cost of living in Milwaukie summary. We use data on the cost of living to determine how expensive it is to live in Milwaukie. Real estate prices drive most of the variance in cost of living around Oregon. Key points include:
The cost of living in Milwaukie is 127 with 100 being average.
The cost of living in Milwaukie is 1.3x higher than the national average.
The median home value in Milwaukie is $505,791.
The median income in Milwaukie is $82,422.
Milwaukie's Overall Cost Of Living
Higher Than The National Average
Cost Of Living In Milwaukie Comparison Table
| Living Expense | Milwaukie | Oregon | National Average | |
|---|---|---|---|---|
| Overall | 127 | 112 | 100 | |
| Services | 105 | 107 | 100 | |
| Groceries | 109 | 107 | 100 | |
| Health | 111 | 104 | 100 | |
| Housing | 175 | 124 | 100 | |
| Transportation | 126 | 116 | 100 | |
| Utilities | 94 | 97 | 100 | |
Milwaukie, OR Weather
The average high in Milwaukie is 63.2° and the average low is 44.6°.
There are 94.7 days of precipitation each year.
Expect an average of 42.2 inches of precipitation each year with 2.1 inches of snow.
| Stat | Milwaukie |
|---|---|
| Average Annual High | 63.2 |
| Average Annual Low | 44.6 |
| Annual Precipitation Days | 94.7 |
| Average Annual Precipitation | 42.2 |
| Average Annual Snowfall | 2.1 |
Average High
Days of Rain
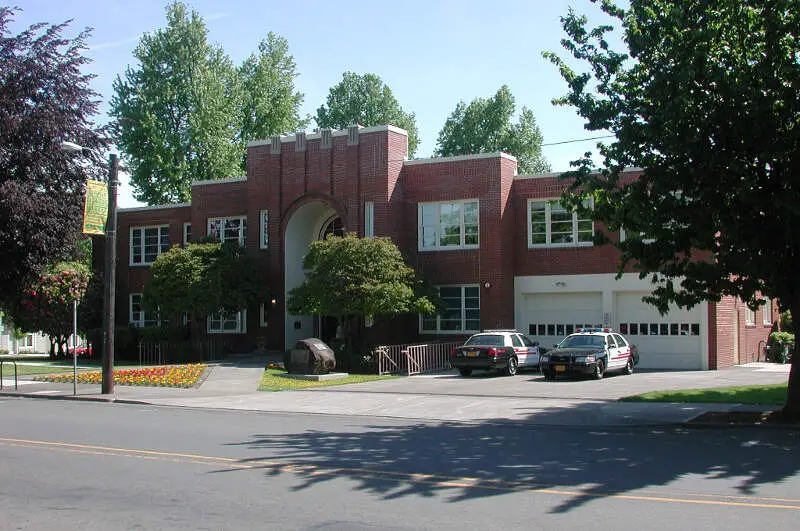
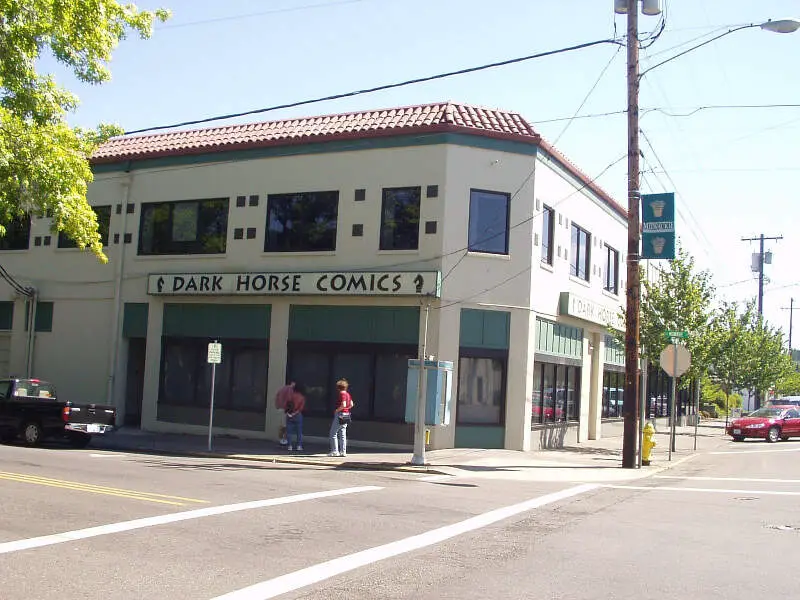
Milwaukie, OR Photos


1 Reviews & Comments About Milwaukie
/5

HomeSnacks User - 2018-07-16 03:55:37.943499
School system is fantastic and it is a really quiet pretty area south of Portland
Property values are much better than much of the Portland metro area.
Rankings for Milwaukie in Oregon


Locations Around Milwaukie
Map Of Milwaukie, OR
Best Places Around Milwaukie
Oregon, WI
Population 11,384
Washougal, WA
Population 16,945
Hazel Dell, WA
Population 23,086
Vancouver, WA
Population 192,696
Camas, WA
Population 26,779
Five Corners, WA
Population 21,444
Lake Oswego, OR
Population 40,367
West Linn, OR
Population 27,065
Orchards, WA
Population 29,716
Milwaukie Demographics And Statistics
Population over time in Milwaukie
The current population in Milwaukie is 21,256. The population has increased 4.2% from 2010.
| Year | Population | % Change |
|---|---|---|
| 2023 | 21,256 | 0.3% |
| 2022 | 21,195 | 0.4% |
| 2021 | 21,108 | 0.1% |
| 2020 | 21,086 | 0.4% |
| 2019 | 21,009 | 0.3% |
| 2018 | 20,955 | 1.6% |
| 2017 | 20,627 | -0.1% |
| 2016 | 20,643 | 0.4% |
| 2015 | 20,566 | 0.6% |
| 2014 | 20,449 | 0.3% |
| 2013 | 20,385 | -0.0% |
| 2012 | 20,391 | -0.1% |
| 2011 | 20,414 | 0.1% |
| 2010 | 20,393 | - |
Race / Ethnicity in Milwaukie
Milwaukie is:
75.8% White with 16,108 White residents.
1.8% African American with 385 African American residents.
0.3% American Indian with 74 American Indian residents.
2.8% Asian with 599 Asian residents.
0.2% Hawaiian with 52 Hawaiian residents.
0.3% Other with 58 Other residents.
8.3% Two Or More with 1,758 Two Or More residents.
10.5% Hispanic with 2,222 Hispanic residents.
| Race | Milwaukie | OR | USA |
|---|---|---|---|
| White | 75.8% | 72.3% | 58.2% |
| African American | 1.8% | 1.8% | 12.0% |
| American Indian | 0.3% | 0.7% | 0.5% |
| Asian | 2.8% | 4.4% | 5.7% |
| Hawaiian | 0.2% | 0.4% | 0.2% |
| Other | 0.3% | 0.5% | 0.5% |
| Two Or More | 8.3% | 5.6% | 3.9% |
| Hispanic | 10.5% | 14.3% | 19.0% |
Gender in Milwaukie
Milwaukie is 50.9% female with 10,828 female residents.
Milwaukie is 49.1% male with 10,428 male residents.
| Gender | Milwaukie | OR | USA |
|---|---|---|---|
| Female | 50.9% | 50.1% | 50.5% |
| Male | 49.1% | 49.9% | 49.5% |
Highest level of educational attainment in Milwaukie for adults over 25
1.0% of adults in Milwaukie completed < 9th grade.
3.0% of adults in Milwaukie completed 9-12th grade.
20.0% of adults in Milwaukie completed high school / ged.
26.0% of adults in Milwaukie completed some college.
9.0% of adults in Milwaukie completed associate's degree.
28.0% of adults in Milwaukie completed bachelor's degree.
9.0% of adults in Milwaukie completed master's degree.
2.0% of adults in Milwaukie completed professional degree.
2.0% of adults in Milwaukie completed doctorate degree.
| Education | Milwaukie | OR | USA |
|---|---|---|---|
| < 9th Grade | 1.0% | 4.0% | 5.0% |
| 9-12th Grade | 3.0% | 5.0% | 6.0% |
| High School / GED | 20.0% | 22.0% | 26.0% |
| Some College | 26.0% | 24.0% | 19.0% |
| Associate's Degree | 9.0% | 9.0% | 9.0% |
| Bachelor's Degree | 28.0% | 22.0% | 21.0% |
| Master's Degree | 9.0% | 10.0% | 10.0% |
| Professional Degree | 2.0% | 2.0% | 2.0% |
| Doctorate Degree | 2.0% | 2.0% | 2.0% |
Household Income For Milwaukie, Oregon
3.3% of households in Milwaukie earn Less than $10,000.
1.4% of households in Milwaukie earn $10,000 to $14,999.
4.0% of households in Milwaukie earn $15,000 to $24,999.
4.9% of households in Milwaukie earn $25,000 to $34,999.
13.7% of households in Milwaukie earn $35,000 to $49,999.
18.9% of households in Milwaukie earn $50,000 to $74,999.
11.0% of households in Milwaukie earn $75,000 to $99,999.
18.7% of households in Milwaukie earn $100,000 to $149,999.
12.7% of households in Milwaukie earn $150,000 to $199,999.
11.4% of households in Milwaukie earn $200,000 or more.
| Income | Milwaukie | OR | USA |
|---|---|---|---|
| Less than $10,000 | 3.3% | 4.4% | 4.9% |
| $10,000 to $14,999 | 1.4% | 3.4% | 3.6% |
| $15,000 to $24,999 | 4.0% | 6.3% | 6.6% |
| $25,000 to $34,999 | 4.9% | 6.4% | 6.8% |
| $35,000 to $49,999 | 13.7% | 10.5% | 10.4% |
| $50,000 to $74,999 | 18.9% | 15.9% | 15.7% |
| $75,000 to $99,999 | 11.0% | 13.3% | 12.7% |
| $100,000 to $149,999 | 18.7% | 18.5% | 17.4% |
| $150,000 to $199,999 | 12.7% | 9.6% | 9.3% |
| $200,000 or more | 11.4% | 11.8% | 12.6% |


