Allentown, PA
Demographics And Statistics
Living In Allentown, Pennsylvania Summary
Life in Allentown research summary. HomeSnacks has been using Saturday Night Science to research the quality of life in Allentown over the past nine years using Census, FBI, Zillow, and other primary data sources. Based on the most recently available data, we found the following about life in Allentown:
The population in Allentown is 125,320.
The median home value in Allentown is $305,255.
The median income in Allentown is $53,403.
The cost of living in Allentown is 97 which is 1.0x lower than the national average.
The median rent in Allentown is $1,269.
The unemployment rate in Allentown is 8.8%.
The poverty rate in Allentown is 21.6%.
The average high in Allentown is 61.8° and the average low is 41.8°.
Allentown SnackAbility
Overall SnackAbility
Allentown, PA Crime Report
Crime in Allentown summary. We use data from the FBI to determine the crime rates in Allentown. Key points include:
There were 2,294 total crimes in Allentown in the last reporting year.
The overall crime rate per 100,000 people in Allentown is 1,841.1 / 100k people.
The violent crime rate per 100,000 people in Allentown is 272.1 / 100k people.
The property crime rate per 100,000 people in Allentown is 1,569.0 / 100k people.
Overall, crime in Allentown is -13.12% below the national average.
Total Crimes
Below National Average
Crime In Allentown Comparison Table
| Statistic | Count Raw |
Allentown / 100k People |
Pennsylvania / 100k People |
National / 100k People |
|---|---|---|---|---|
| Total Crimes Per 100K | 2,294 | 1,841.1 | 1,680.6 | 2,119.2 |
| Violent Crime | 339 | 272.1 | 245.6 | 359.0 |
| Murder | 4 | 3.2 | 5.0 | 5.0 |
| Robbery | 71 | 57.0 | 51.4 | 61.0 |
| Aggravated Assault | 231 | 185.4 | 161.4 | 256.0 |
| Property Crime | 1,955 | 1,569.0 | 1,435.0 | 1,760.0 |
| Burglary | 151 | 121.2 | 116.7 | 229.0 |
| Larceny | 1,560 | 1,252.0 | 1,129.8 | 1,272.0 |
| Car Theft | 244 | 195.8 | 188.5 | 259.0 |
Allentown, PA Cost Of Living
Cost of living in Allentown summary. We use data on the cost of living to determine how expensive it is to live in Allentown. Real estate prices drive most of the variance in cost of living around Pennsylvania. Key points include:
The cost of living in Allentown is 97 with 100 being average.
The cost of living in Allentown is 1.0x lower than the national average.
The median home value in Allentown is $305,255.
The median income in Allentown is $53,403.
Allentown's Overall Cost Of Living
Lower Than The National Average
Cost Of Living In Allentown Comparison Table
| Living Expense | Allentown | Pennsylvania | National Average | |
|---|---|---|---|---|
| Overall | 97 | 100 | 100 | |
| Services | 107 | 101 | 100 | |
| Groceries | 99 | 101 | 100 | |
| Health | 97 | 95 | 100 | |
| Housing | 85 | 93 | 100 | |
| Transportation | 104 | 108 | 100 | |
| Utilities | 108 | 108 | 100 | |
Allentown, PA Weather
The average high in Allentown is 61.8° and the average low is 41.8°.
There are 76.8 days of precipitation each year.
Expect an average of 45.6 inches of precipitation each year with 31.5 inches of snow.
| Stat | Allentown |
|---|---|
| Average Annual High | 61.8 |
| Average Annual Low | 41.8 |
| Annual Precipitation Days | 76.8 |
| Average Annual Precipitation | 45.6 |
| Average Annual Snowfall | 31.5 |
Average High
Days of Rain
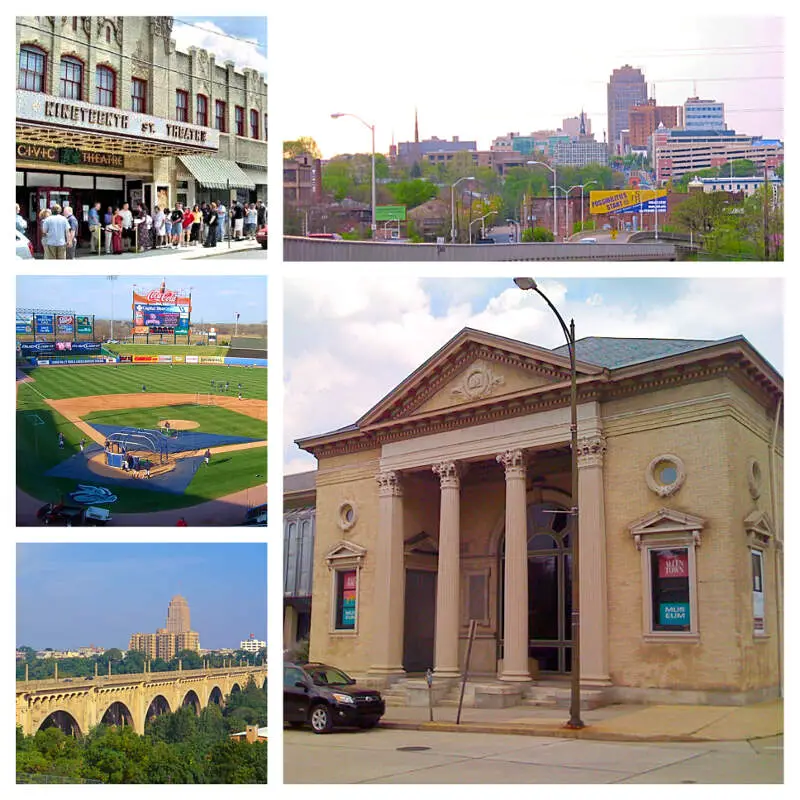
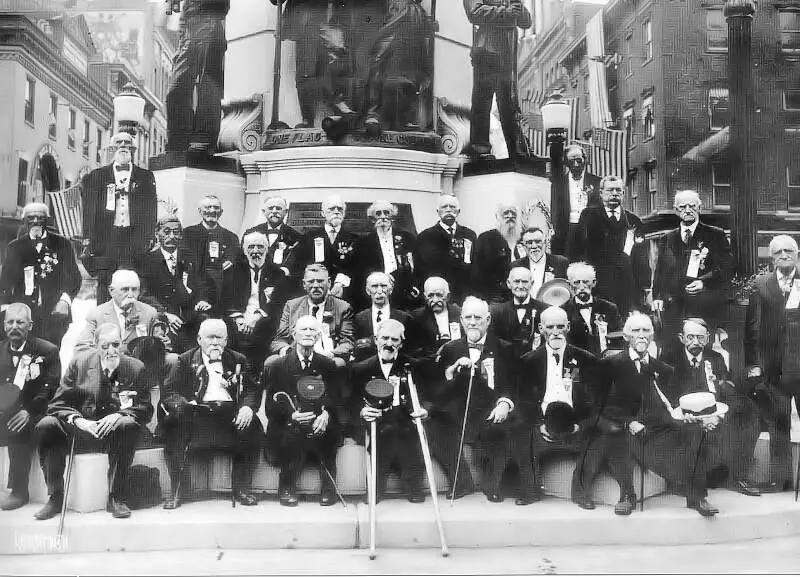
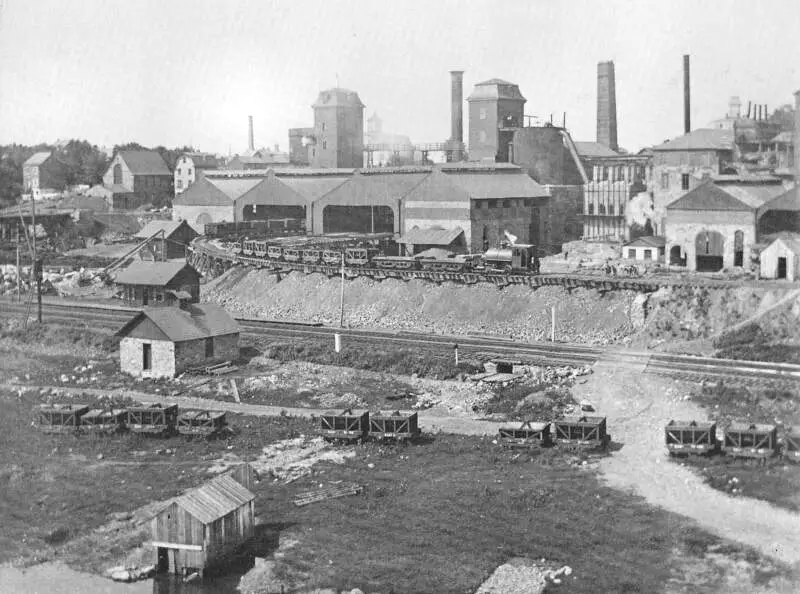
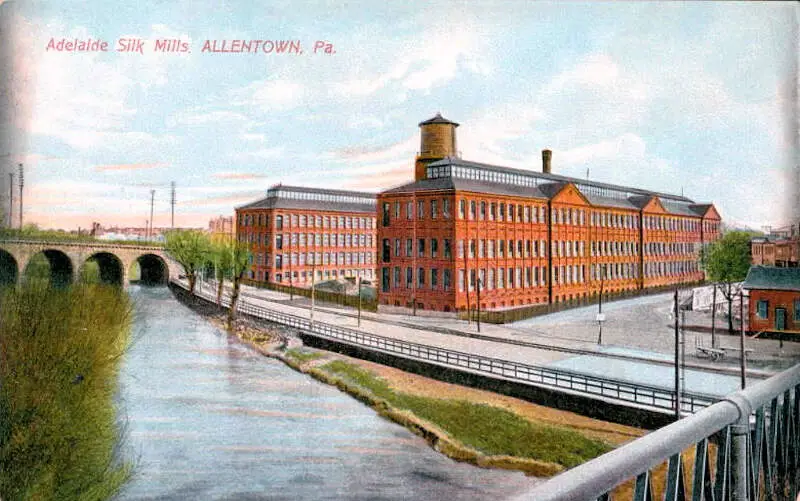
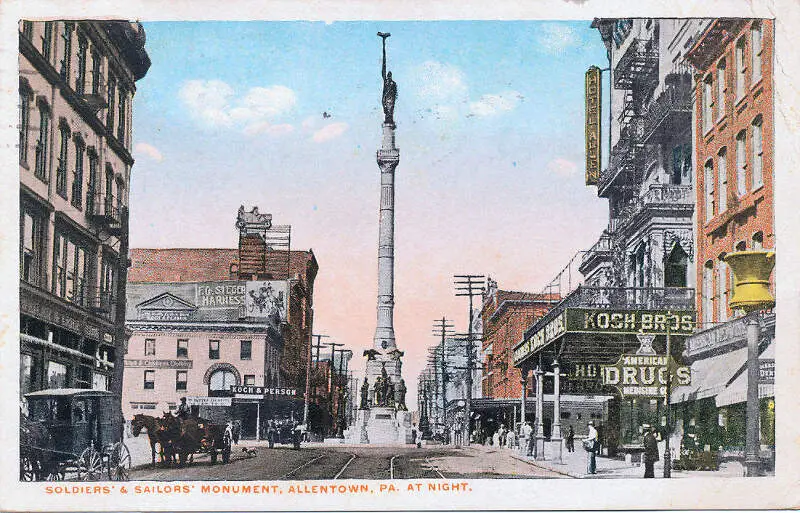
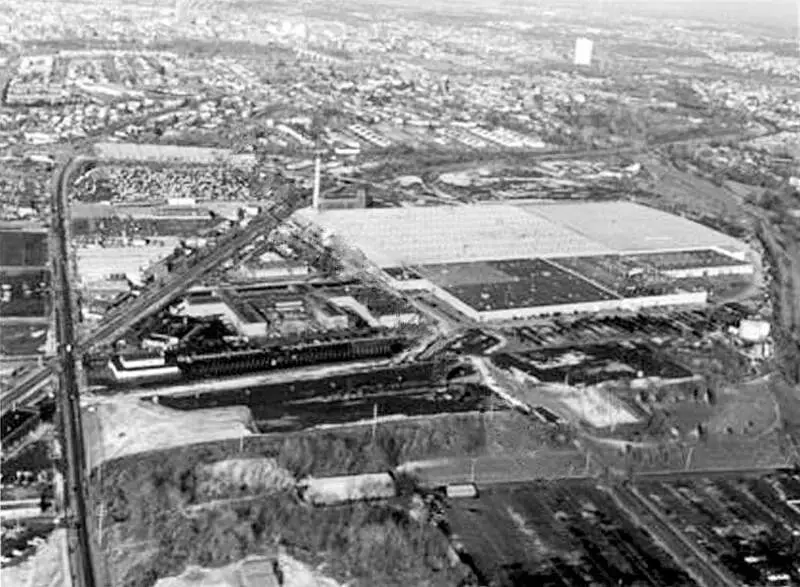
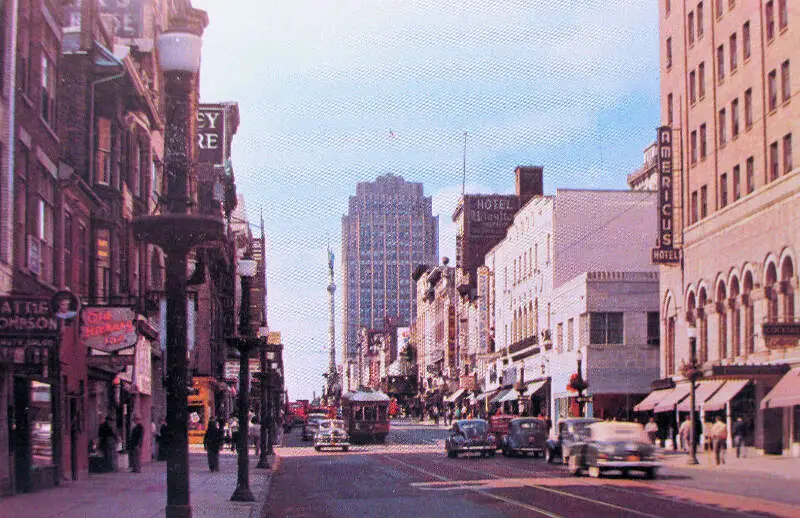
Allentown, PA Photos


Rankings for Allentown in Pennsylvania


Locations Around Allentown
Map Of Allentown, PA
Best Places Around Allentown
Hamilton Square, NJ
Population 11,643
Yardville, NJ
Population 6,266
Mercerville, NJ
Population 13,693
White Horse, NJ
Population 10,040
Twin Rivers, NJ
Population 8,315
Fort Dix, NJ
Population 8,034
Yorketown, NJ
Population 7,265
Levittown, PA
Population 50,930
Kendall Park, NJ
Population 10,765
West Freehold, NJ
Population 14,233
Allentown Demographics And Statistics
Population over time in Allentown
The current population in Allentown is 125,320. The population has increased 7.7% from 2010.
| Year | Population | % Change |
|---|---|---|
| 2023 | 125,320 | 0.0% |
| 2022 | 125,292 | 0.0% |
| 2021 | 125,250 | 3.4% |
| 2020 | 121,156 | 0.2% |
| 2019 | 120,915 | 0.4% |
| 2018 | 120,410 | 0.2% |
| 2017 | 120,128 | 0.4% |
| 2016 | 119,624 | 0.3% |
| 2015 | 119,261 | 0.4% |
| 2014 | 118,793 | 0.4% |
| 2013 | 118,285 | 0.3% |
| 2012 | 117,942 | 0.5% |
| 2011 | 117,386 | 0.8% |
| 2010 | 116,398 | - |
Race / Ethnicity in Allentown
Allentown is:
30.0% White with 37,603 White residents.
11.0% African American with 13,766 African American residents.
0.1% American Indian with 68 American Indian residents.
2.5% Asian with 3,112 Asian residents.
0.0% Hawaiian with 30 Hawaiian residents.
0.5% Other with 566 Other residents.
2.2% Two Or More with 2,714 Two Or More residents.
53.8% Hispanic with 67,461 Hispanic residents.
| Race | Allentown | PA | USA |
|---|---|---|---|
| White | 30.0% | 73.8% | 58.2% |
| African American | 11.0% | 10.3% | 12.0% |
| American Indian | 0.1% | 0.1% | 0.5% |
| Asian | 2.5% | 3.7% | 5.7% |
| Hawaiian | 0.0% | 0.0% | 0.2% |
| Other | 0.5% | 0.4% | 0.5% |
| Two Or More | 2.2% | 3.3% | 3.9% |
| Hispanic | 53.8% | 8.4% | 19.0% |
Gender in Allentown
Allentown is 51.2% female with 64,143 female residents.
Allentown is 48.8% male with 61,176 male residents.
| Gender | Allentown | PA | USA |
|---|---|---|---|
| Female | 51.2% | 50.7% | 50.5% |
| Male | 48.8% | 49.3% | 49.5% |
Highest level of educational attainment in Allentown for adults over 25
8.0% of adults in Allentown completed < 9th grade.
10.0% of adults in Allentown completed 9-12th grade.
38.0% of adults in Allentown completed high school / ged.
17.0% of adults in Allentown completed some college.
7.0% of adults in Allentown completed associate's degree.
14.0% of adults in Allentown completed bachelor's degree.
4.0% of adults in Allentown completed master's degree.
1.0% of adults in Allentown completed professional degree.
1.0% of adults in Allentown completed doctorate degree.
| Education | Allentown | PA | USA |
|---|---|---|---|
| < 9th Grade | 8.0% | 3.0% | 5.0% |
| 9-12th Grade | 10.0% | 5.0% | 6.0% |
| High School / GED | 38.0% | 33.0% | 26.0% |
| Some College | 17.0% | 15.0% | 19.0% |
| Associate's Degree | 7.0% | 9.0% | 9.0% |
| Bachelor's Degree | 14.0% | 21.0% | 21.0% |
| Master's Degree | 4.0% | 10.0% | 10.0% |
| Professional Degree | 1.0% | 2.0% | 2.0% |
| Doctorate Degree | 1.0% | 2.0% | 2.0% |
Household Income For Allentown, Pennsylvania
4.7% of households in Allentown earn Less than $10,000.
6.3% of households in Allentown earn $10,000 to $14,999.
11.3% of households in Allentown earn $15,000 to $24,999.
10.7% of households in Allentown earn $25,000 to $34,999.
14.5% of households in Allentown earn $35,000 to $49,999.
19.5% of households in Allentown earn $50,000 to $74,999.
12.8% of households in Allentown earn $75,000 to $99,999.
12.1% of households in Allentown earn $100,000 to $149,999.
5.1% of households in Allentown earn $150,000 to $199,999.
3.2% of households in Allentown earn $200,000 or more.
| Income | Allentown | PA | USA |
|---|---|---|---|
| Less than $10,000 | 4.7% | 4.8% | 4.9% |
| $10,000 to $14,999 | 6.3% | 3.7% | 3.6% |
| $15,000 to $24,999 | 11.3% | 7.0% | 6.6% |
| $25,000 to $34,999 | 10.7% | 7.1% | 6.8% |
| $35,000 to $49,999 | 14.5% | 10.7% | 10.4% |
| $50,000 to $74,999 | 19.5% | 16.1% | 15.7% |
| $75,000 to $99,999 | 12.8% | 12.9% | 12.7% |
| $100,000 to $149,999 | 12.1% | 17.6% | 17.4% |
| $150,000 to $199,999 | 5.1% | 9.0% | 9.3% |
| $200,000 or more | 3.2% | 11.1% | 12.6% |


