Beaver Falls, PA
Demographics And Statistics
Living In Beaver Falls, Pennsylvania Summary
Life in Beaver Falls research summary. HomeSnacks has been using Saturday Night Science to research the quality of life in Beaver Falls over the past nine years using Census, FBI, Zillow, and other primary data sources. Based on the most recently available data, we found the following about life in Beaver Falls:
The population in Beaver Falls is 8,885.
The median home value in Beaver Falls is $184,365.
The median income in Beaver Falls is $48,462.
The cost of living in Beaver Falls is 87 which is 0.9x lower than the national average.
The median rent in Beaver Falls is $740.
The unemployment rate in Beaver Falls is 9.1%.
The poverty rate in Beaver Falls is 21.7%.
The average high in Beaver Falls is 60.6° and the average low is 40.2°.
Table Of Contents
Beaver Falls SnackAbility
Overall SnackAbility
Beaver Falls, PA Cost Of Living
Cost of living in Beaver Falls summary. We use data on the cost of living to determine how expensive it is to live in Beaver Falls. Real estate prices drive most of the variance in cost of living around Pennsylvania. Key points include:
The cost of living in Beaver Falls is 87 with 100 being average.
The cost of living in Beaver Falls is 0.9x lower than the national average.
The median home value in Beaver Falls is $184,365.
The median income in Beaver Falls is $48,462.
Beaver Falls's Overall Cost Of Living
Lower Than The National Average
Cost Of Living In Beaver Falls Comparison Table
| Living Expense | Beaver Falls | Pennsylvania | National Average | |
|---|---|---|---|---|
| Overall | 87 | 100 | 100 | |
| Services | 91 | 101 | 100 | |
| Groceries | 102 | 101 | 100 | |
| Health | 91 | 95 | 100 | |
| Housing | 50 | 93 | 100 | |
| Transportation | 108 | 108 | 100 | |
| Utilities | 125 | 108 | 100 | |
Beaver Falls, PA Weather
The average high in Beaver Falls is 60.6° and the average low is 40.2°.
There are 83.4 days of precipitation each year.
Expect an average of 37.5 inches of precipitation each year with 11.4 inches of snow.
| Stat | Beaver Falls |
|---|---|
| Average Annual High | 60.6 |
| Average Annual Low | 40.2 |
| Annual Precipitation Days | 83.4 |
| Average Annual Precipitation | 37.5 |
| Average Annual Snowfall | 11.4 |
Average High
Days of Rain
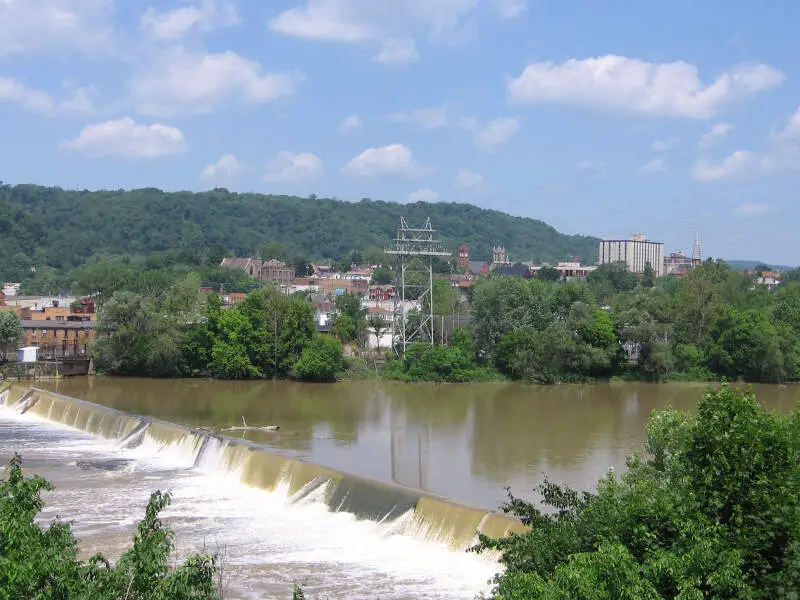
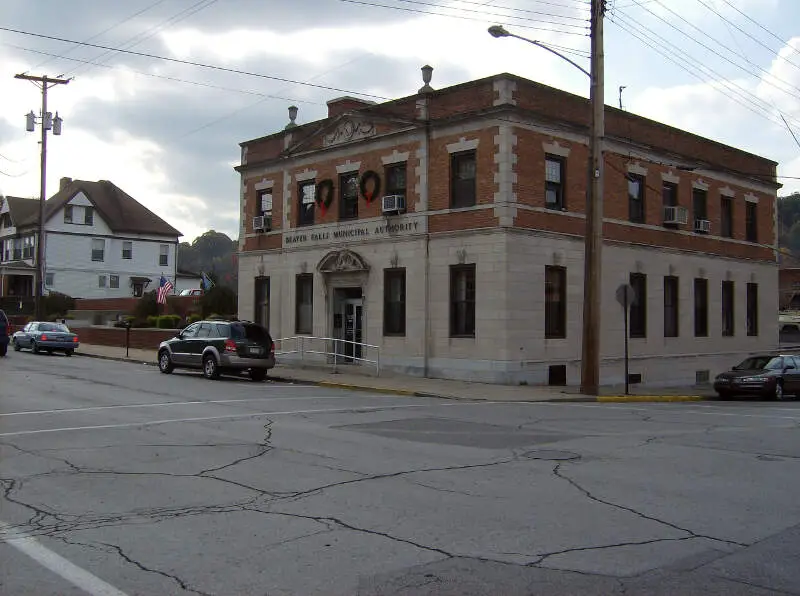
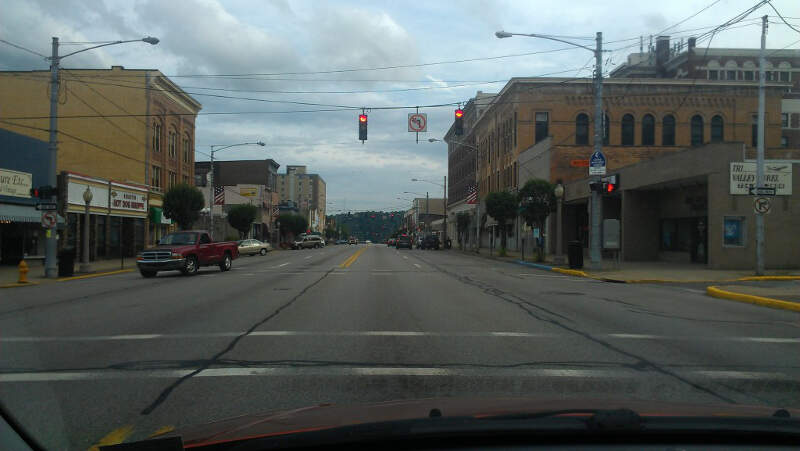
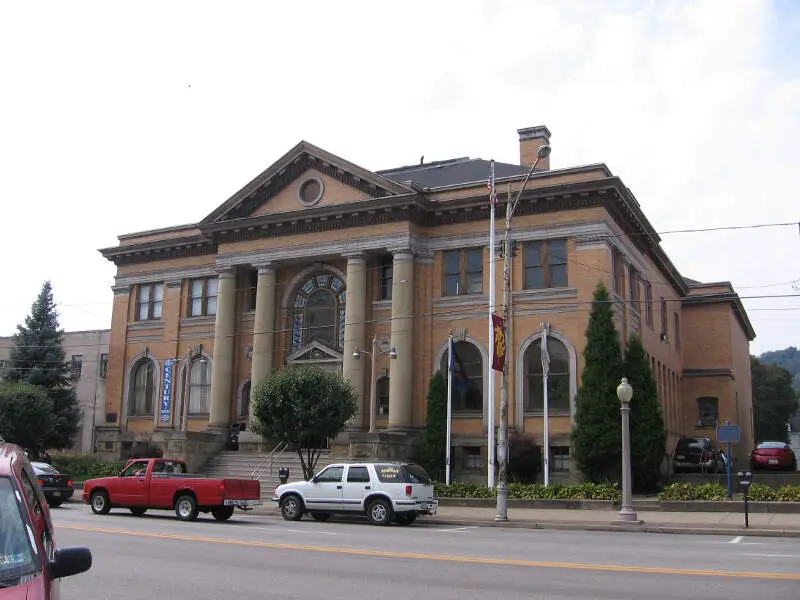
Beaver Falls, PA Photos
Rankings for Beaver Falls in Pennsylvania


Locations Around Beaver Falls
Map Of Beaver Falls, PA
Best Places Around Beaver Falls
Franklin Park, PA
Population 15,273
Economy, PA
Population 9,042
Carnot-Moon, PA
Population 13,639
Coraopolis, PA
Population 5,464
Monaca, PA
Population 5,557
East Liverpool, OH
Population 9,869
New Brighton, PA
Population 5,600
Ambridge, PA
Population 6,912
Aliquippa, PA
Population 9,146
Georgetown, SC
Population 8,511
Beaver Falls Demographics And Statistics
Population over time in Beaver Falls
The current population in Beaver Falls is 8,885. The population has decreased -2.3% from 2010.
| Year | Population | % Change |
|---|---|---|
| 2023 | 8,885 | -0.5% |
| 2022 | 8,934 | -1.5% |
| 2021 | 9,069 | 8.1% |
| 2020 | 8,393 | -0.8% |
| 2019 | 8,464 | -1.0% |
| 2018 | 8,547 | -1.1% |
| 2017 | 8,641 | -1.1% |
| 2016 | 8,735 | -0.4% |
| 2015 | 8,768 | -0.8% |
| 2014 | 8,842 | -0.6% |
| 2013 | 8,897 | -0.5% |
| 2012 | 8,945 | -2.0% |
| 2011 | 9,123 | 0.3% |
| 2010 | 9,092 | - |
Race / Ethnicity in Beaver Falls
Beaver Falls is:
65.3% White with 5,804 White residents.
25.3% African American with 2,245 African American residents.
0.0% American Indian with 2 American Indian residents.
1.3% Asian with 115 Asian residents.
0.0% Hawaiian with 0 Hawaiian residents.
0.1% Other with 12 Other residents.
4.5% Two Or More with 401 Two Or More residents.
3.4% Hispanic with 306 Hispanic residents.
| Race | Beaver Falls | PA | USA |
|---|---|---|---|
| White | 65.3% | 73.8% | 58.2% |
| African American | 25.3% | 10.3% | 12.0% |
| American Indian | 0.0% | 0.1% | 0.5% |
| Asian | 1.3% | 3.7% | 5.7% |
| Hawaiian | 0.0% | 0.0% | 0.2% |
| Other | 0.1% | 0.4% | 0.5% |
| Two Or More | 4.5% | 3.3% | 3.9% |
| Hispanic | 3.4% | 8.4% | 19.0% |
Gender in Beaver Falls
Beaver Falls is 52.7% female with 4,685 female residents.
Beaver Falls is 47.3% male with 4,200 male residents.
| Gender | Beaver Falls | PA | USA |
|---|---|---|---|
| Female | 52.7% | 50.7% | 50.5% |
| Male | 47.3% | 49.3% | 49.5% |
Highest level of educational attainment in Beaver Falls for adults over 25
3.0% of adults in Beaver Falls completed < 9th grade.
7.0% of adults in Beaver Falls completed 9-12th grade.
44.0% of adults in Beaver Falls completed high school / ged.
17.0% of adults in Beaver Falls completed some college.
9.0% of adults in Beaver Falls completed associate's degree.
13.0% of adults in Beaver Falls completed bachelor's degree.
7.0% of adults in Beaver Falls completed master's degree.
0.0% of adults in Beaver Falls completed professional degree.
0.0% of adults in Beaver Falls completed doctorate degree.
| Education | Beaver Falls | PA | USA |
|---|---|---|---|
| < 9th Grade | 3.0% | 3.0% | 5.0% |
| 9-12th Grade | 7.0% | 5.0% | 6.0% |
| High School / GED | 44.0% | 33.0% | 26.0% |
| Some College | 17.0% | 15.0% | 19.0% |
| Associate's Degree | 9.0% | 9.0% | 9.0% |
| Bachelor's Degree | 13.0% | 21.0% | 21.0% |
| Master's Degree | 7.0% | 10.0% | 10.0% |
| Professional Degree | 0.0% | 2.0% | 2.0% |
| Doctorate Degree | 0.0% | 2.0% | 2.0% |
Household Income For Beaver Falls, Pennsylvania
13.5% of households in Beaver Falls earn Less than $10,000.
5.9% of households in Beaver Falls earn $10,000 to $14,999.
12.9% of households in Beaver Falls earn $15,000 to $24,999.
8.3% of households in Beaver Falls earn $25,000 to $34,999.
11.4% of households in Beaver Falls earn $35,000 to $49,999.
21.0% of households in Beaver Falls earn $50,000 to $74,999.
10.5% of households in Beaver Falls earn $75,000 to $99,999.
13.9% of households in Beaver Falls earn $100,000 to $149,999.
1.9% of households in Beaver Falls earn $150,000 to $199,999.
0.8% of households in Beaver Falls earn $200,000 or more.
| Income | Beaver Falls | PA | USA |
|---|---|---|---|
| Less than $10,000 | 13.5% | 4.8% | 4.9% |
| $10,000 to $14,999 | 5.9% | 3.7% | 3.6% |
| $15,000 to $24,999 | 12.9% | 7.0% | 6.6% |
| $25,000 to $34,999 | 8.3% | 7.1% | 6.8% |
| $35,000 to $49,999 | 11.4% | 10.7% | 10.4% |
| $50,000 to $74,999 | 21.0% | 16.1% | 15.7% |
| $75,000 to $99,999 | 10.5% | 12.9% | 12.7% |
| $100,000 to $149,999 | 13.9% | 17.6% | 17.4% |
| $150,000 to $199,999 | 1.9% | 9.0% | 9.3% |
| $200,000 or more | 0.8% | 11.1% | 12.6% |


