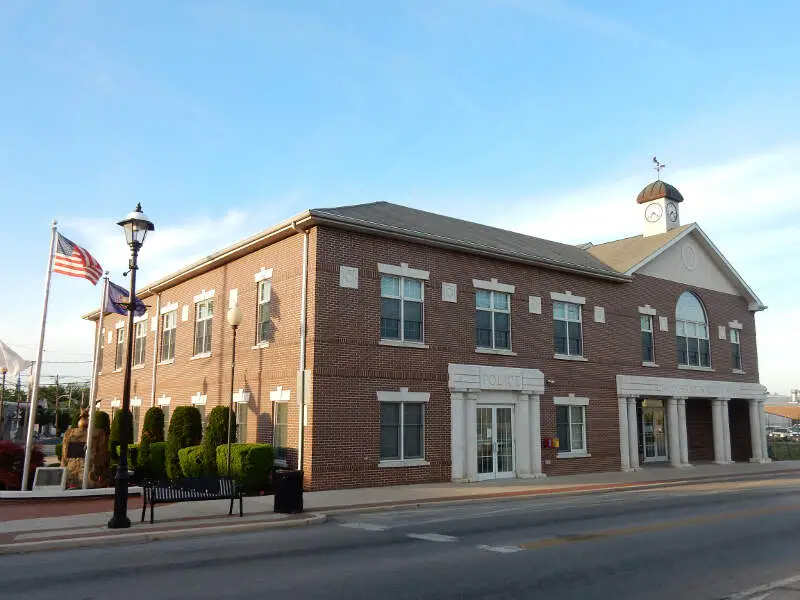
Bridgeport, PA
Demographics And Statistics
Living In Bridgeport, Pennsylvania Summary
Life in Bridgeport research summary. HomeSnacks has been using Saturday Night Science to research the quality of life in Bridgeport over the past nine years using Census, FBI, Zillow, and other primary data sources. Based on the most recently available data, we found the following about life in Bridgeport:
The population in Bridgeport is 5,085.
The median home value in Bridgeport is $346,928.
The median income in Bridgeport is $79,247.
The median rent in Bridgeport is $1,468.
The unemployment rate in Bridgeport is 2.8%.
The poverty rate in Bridgeport is 16.7%.
The average high in Bridgeport is 64.2° and the average low is 44.7°.
Table Of Contents
Bridgeport SnackAbility
Overall SnackAbility
Bridgeport, PA Weather
The average high in Bridgeport is 64.2° and the average low is 44.7°.
There are 79.6 days of precipitation each year.
Expect an average of 46.6 inches of precipitation each year with 18.5 inches of snow.
| Stat | Bridgeport |
|---|---|
| Average Annual High | 64.2 |
| Average Annual Low | 44.7 |
| Annual Precipitation Days | 79.6 |
| Average Annual Precipitation | 46.6 |
| Average Annual Snowfall | 18.5 |
Average High
Days of Rain
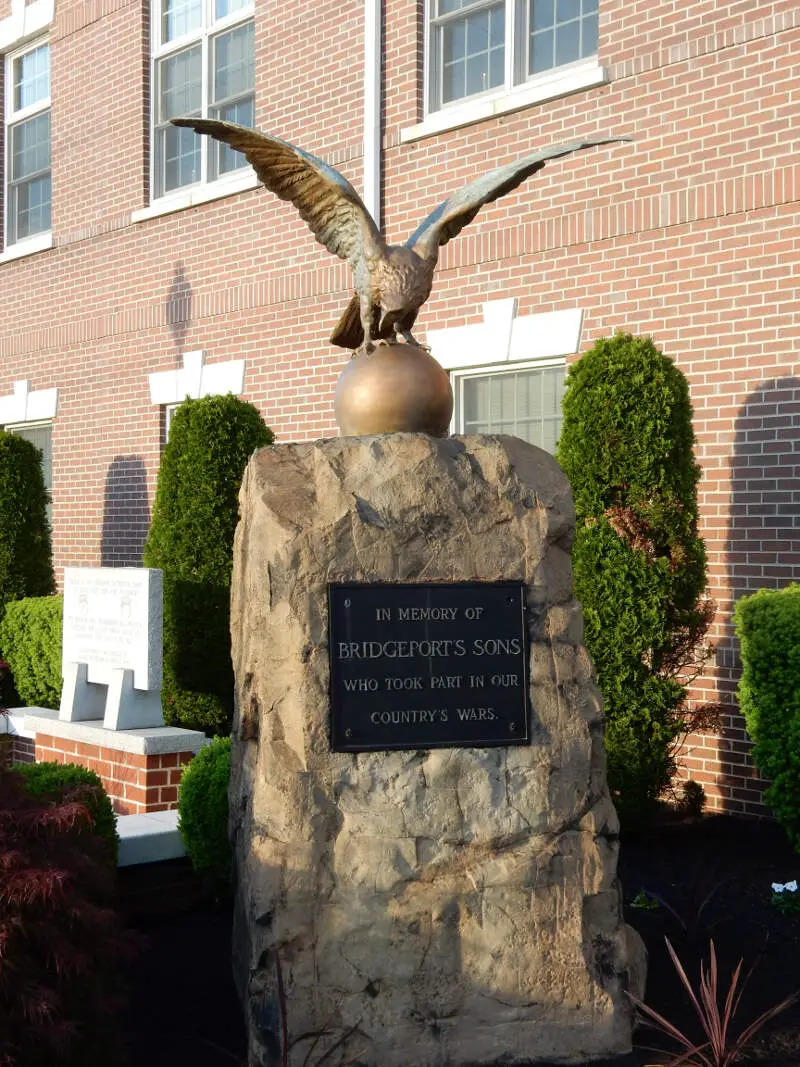
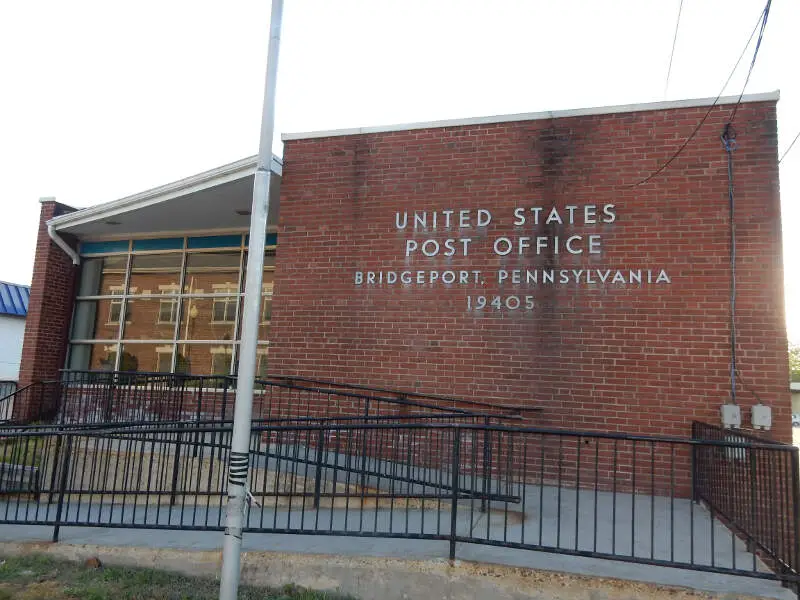
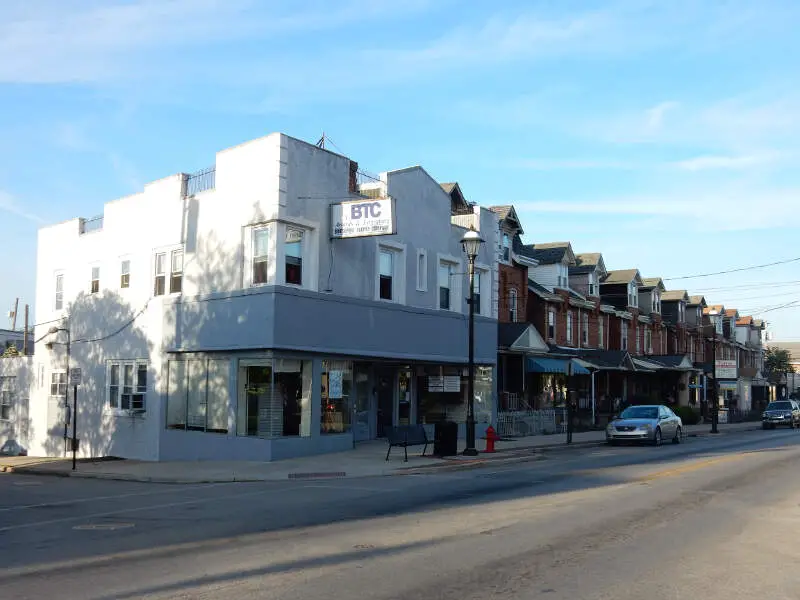
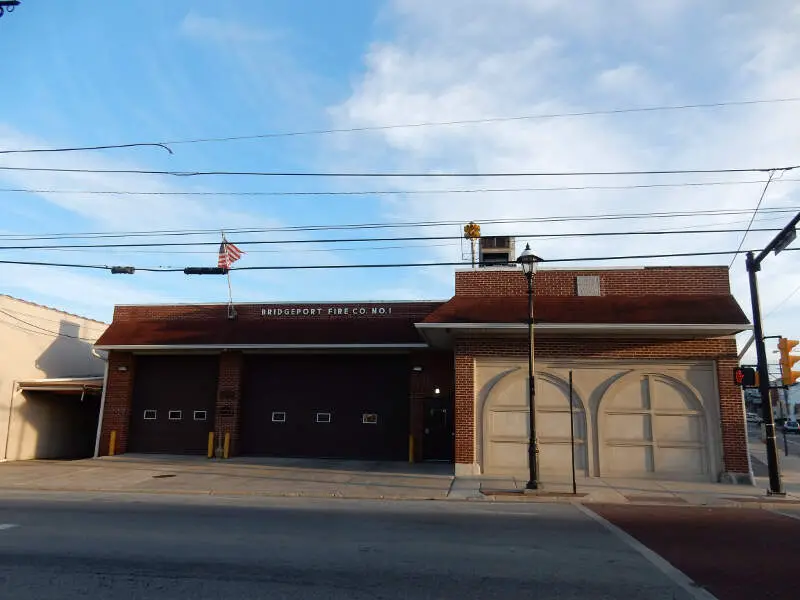
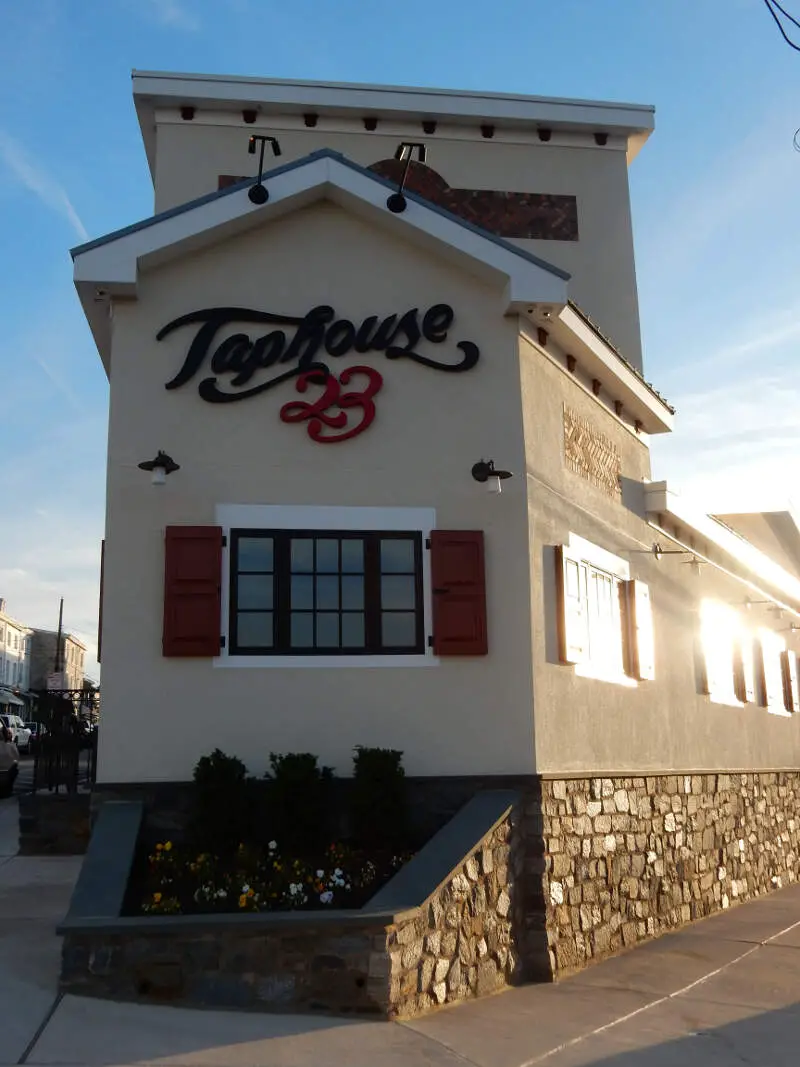
Bridgeport, PA Photos
Rankings for Bridgeport in Pennsylvania


Locations Around Bridgeport
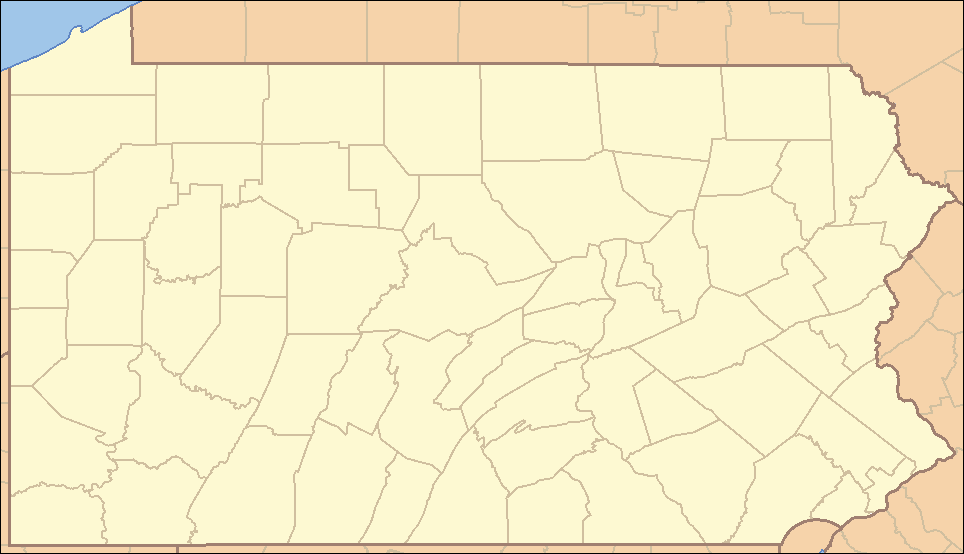
Map Of Bridgeport, PA
Best Places Around Bridgeport
Penn Wynne, PA
Population 6,220
Oreland, PA
Population 6,036
Glenside, PA
Population 7,941
Wyndmoor, PA
Population 5,567
Montgomeryville, PA
Population 13,572
Maple Glen, PA
Population 6,851
Ardmore, PA
Population 14,165
Trooper, PA
Population 5,408
Collegeville, PA
Population 5,226
Blue Bell, PA
Population 6,450
Bridgeport Demographics And Statistics
Population over time in Bridgeport
The current population in Bridgeport is 5,085. The population has increased 12.4% from 2010.
| Year | Population | % Change |
|---|---|---|
| 2023 | 5,085 | 1.7% |
| 2022 | 5,000 | 0.8% |
| 2021 | 4,961 | 8.4% |
| 2020 | 4,576 | -0.1% |
| 2019 | 4,579 | 0.0% |
| 2018 | 4,578 | -0.1% |
| 2017 | 4,582 | 0.2% |
| 2016 | 4,574 | 0.1% |
| 2015 | 4,571 | -0.0% |
| 2014 | 4,573 | 0.3% |
| 2013 | 4,561 | 0.4% |
| 2012 | 4,542 | 0.0% |
| 2011 | 4,542 | 0.4% |
| 2010 | 4,526 | - |
Race / Ethnicity in Bridgeport
Bridgeport is:
59.2% White with 3,009 White residents.
3.4% African American with 174 African American residents.
0.0% American Indian with 0 American Indian residents.
6.1% Asian with 311 Asian residents.
0.0% Hawaiian with 0 Hawaiian residents.
5.2% Other with 266 Other residents.
12.2% Two Or More with 622 Two Or More residents.
13.8% Hispanic with 703 Hispanic residents.
| Race | Bridgeport | PA | USA |
|---|---|---|---|
| White | 59.2% | 73.8% | 58.2% |
| African American | 3.4% | 10.3% | 12.0% |
| American Indian | 0.0% | 0.1% | 0.5% |
| Asian | 6.1% | 3.7% | 5.7% |
| Hawaiian | 0.0% | 0.0% | 0.2% |
| Other | 5.2% | 0.4% | 0.5% |
| Two Or More | 12.2% | 3.3% | 3.9% |
| Hispanic | 13.8% | 8.4% | 19.0% |
Gender in Bridgeport
Bridgeport is 44.5% female with 2,264 female residents.
Bridgeport is 55.5% male with 2,821 male residents.
| Gender | Bridgeport | PA | USA |
|---|---|---|---|
| Female | 44.5% | 50.7% | 50.5% |
| Male | 55.5% | 49.3% | 49.5% |
Highest level of educational attainment in Bridgeport for adults over 25
4.0% of adults in Bridgeport completed < 9th grade.
3.0% of adults in Bridgeport completed 9-12th grade.
28.0% of adults in Bridgeport completed high school / ged.
13.0% of adults in Bridgeport completed some college.
10.0% of adults in Bridgeport completed associate's degree.
29.0% of adults in Bridgeport completed bachelor's degree.
10.0% of adults in Bridgeport completed master's degree.
1.0% of adults in Bridgeport completed professional degree.
2.0% of adults in Bridgeport completed doctorate degree.
| Education | Bridgeport | PA | USA |
|---|---|---|---|
| < 9th Grade | 4.0% | 3.0% | 5.0% |
| 9-12th Grade | 3.0% | 5.0% | 6.0% |
| High School / GED | 28.0% | 33.0% | 26.0% |
| Some College | 13.0% | 15.0% | 19.0% |
| Associate's Degree | 10.0% | 9.0% | 9.0% |
| Bachelor's Degree | 29.0% | 21.0% | 21.0% |
| Master's Degree | 10.0% | 10.0% | 10.0% |
| Professional Degree | 1.0% | 2.0% | 2.0% |
| Doctorate Degree | 2.0% | 2.0% | 2.0% |
Household Income For Bridgeport, Pennsylvania
2.9% of households in Bridgeport earn Less than $10,000.
4.2% of households in Bridgeport earn $10,000 to $14,999.
5.1% of households in Bridgeport earn $15,000 to $24,999.
7.0% of households in Bridgeport earn $25,000 to $34,999.
5.4% of households in Bridgeport earn $35,000 to $49,999.
19.5% of households in Bridgeport earn $50,000 to $74,999.
18.4% of households in Bridgeport earn $75,000 to $99,999.
17.3% of households in Bridgeport earn $100,000 to $149,999.
13.9% of households in Bridgeport earn $150,000 to $199,999.
6.5% of households in Bridgeport earn $200,000 or more.
| Income | Bridgeport | PA | USA |
|---|---|---|---|
| Less than $10,000 | 2.9% | 4.8% | 4.9% |
| $10,000 to $14,999 | 4.2% | 3.7% | 3.6% |
| $15,000 to $24,999 | 5.1% | 7.0% | 6.6% |
| $25,000 to $34,999 | 7.0% | 7.1% | 6.8% |
| $35,000 to $49,999 | 5.4% | 10.7% | 10.4% |
| $50,000 to $74,999 | 19.5% | 16.1% | 15.7% |
| $75,000 to $99,999 | 18.4% | 12.9% | 12.7% |
| $100,000 to $149,999 | 17.3% | 17.6% | 17.4% |
| $150,000 to $199,999 | 13.9% | 9.0% | 9.3% |
| $200,000 or more | 6.5% | 11.1% | 12.6% |


