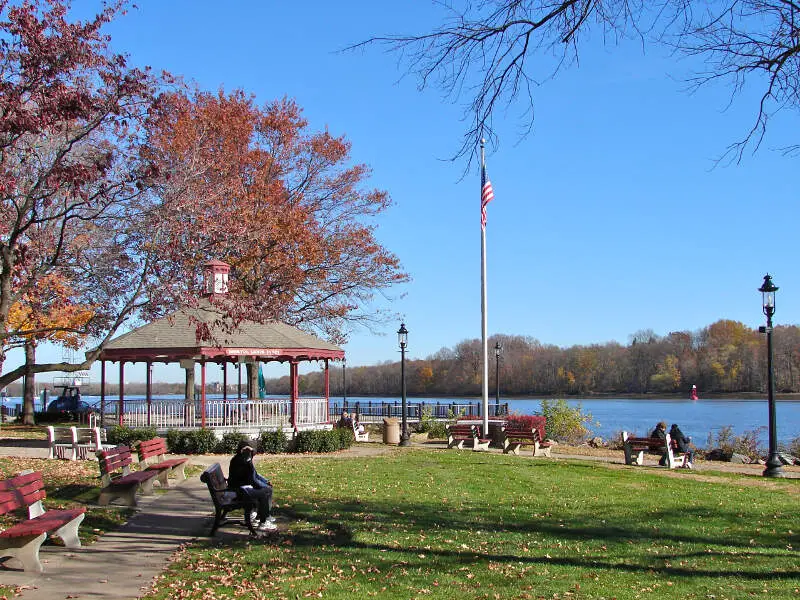
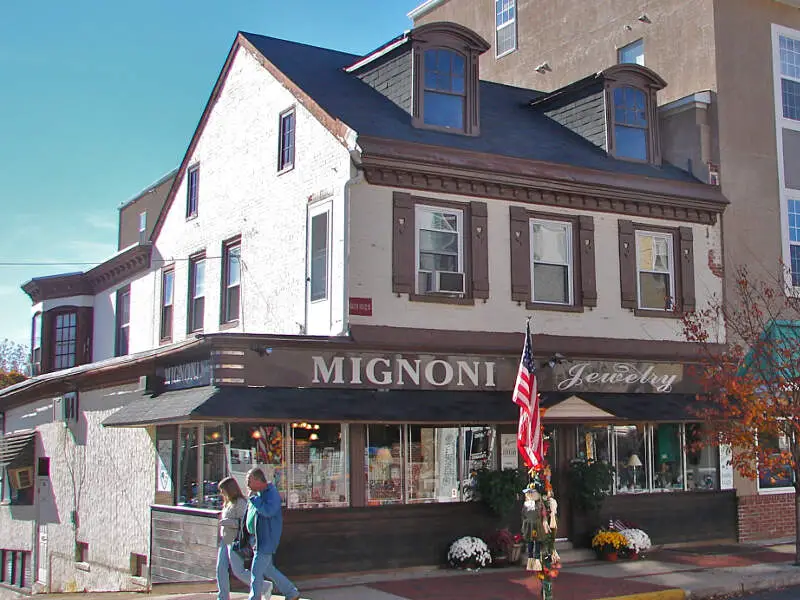
Bristol, PA
Demographics And Statistics
Living In Bristol, Pennsylvania Summary
Life in Bristol research summary. HomeSnacks has been using Saturday Night Science to research the quality of life in Bristol over the past nine years using Census, FBI, Zillow, and other primary data sources. Based on the most recently available data, we found the following about life in Bristol:
The population in Bristol is 9,874.
The median home value in Bristol is $329,277.
The median income in Bristol is $70,595.
The cost of living in Bristol is 103 which is 1.0x higher than the national average.
The median rent in Bristol is $1,281.
The unemployment rate in Bristol is 4.8%.
The poverty rate in Bristol is 7.0%.
The average high in Bristol is 63.2° and the average low is 42.8°.
Table Of Contents
Bristol SnackAbility
Overall SnackAbility
Bristol, PA Cost Of Living
Cost of living in Bristol summary. We use data on the cost of living to determine how expensive it is to live in Bristol. Real estate prices drive most of the variance in cost of living around Pennsylvania. Key points include:
The cost of living in Bristol is 103 with 100 being average.
The cost of living in Bristol is 1.0x higher than the national average.
The median home value in Bristol is $329,277.
The median income in Bristol is $70,595.
Bristol's Overall Cost Of Living
Higher Than The National Average
Cost Of Living In Bristol Comparison Table
| Living Expense | Bristol | Pennsylvania | National Average | |
|---|---|---|---|---|
| Overall | 103 | 100 | 100 | |
| Services | 104 | 101 | 100 | |
| Groceries | 101 | 101 | 100 | |
| Health | 92 | 95 | 100 | |
| Housing | 105 | 93 | 100 | |
| Transportation | 107 | 108 | 100 | |
| Utilities | 110 | 108 | 100 | |
Bristol, PA Weather
The average high in Bristol is 63.2° and the average low is 42.8°.
There are 73.8 days of precipitation each year.
Expect an average of 48.1 inches of precipitation each year with 22.5 inches of snow.
| Stat | Bristol |
|---|---|
| Average Annual High | 63.2 |
| Average Annual Low | 42.8 |
| Annual Precipitation Days | 73.8 |
| Average Annual Precipitation | 48.1 |
| Average Annual Snowfall | 22.5 |
Average High
Days of Rain
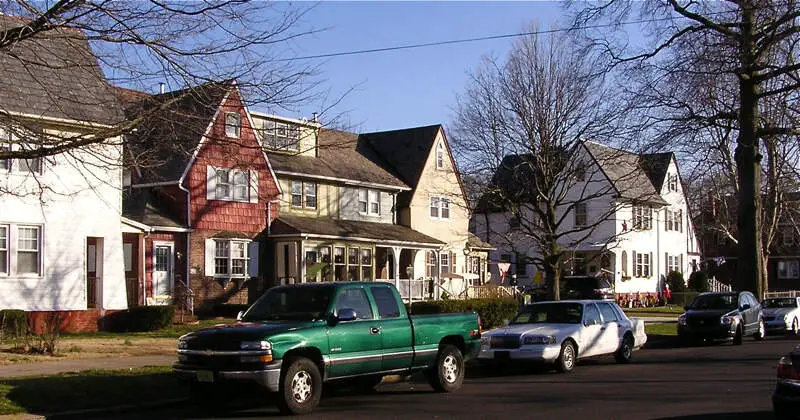
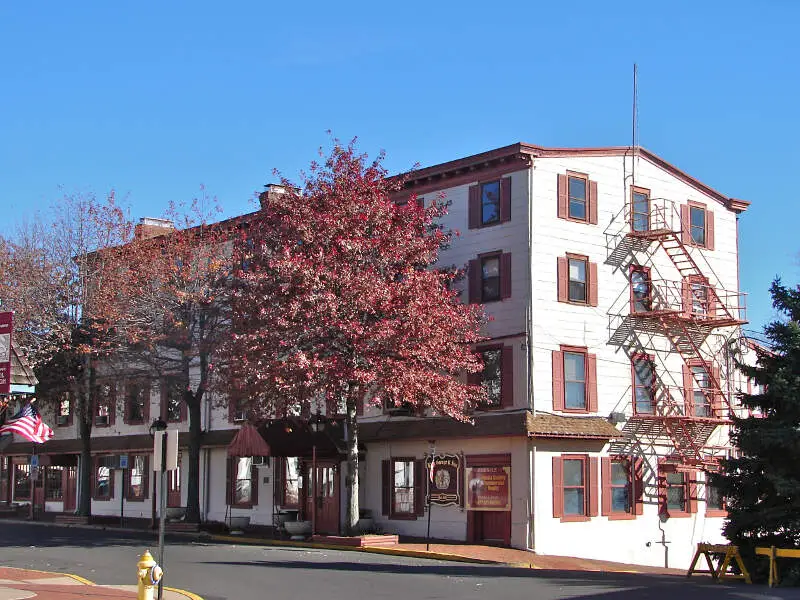
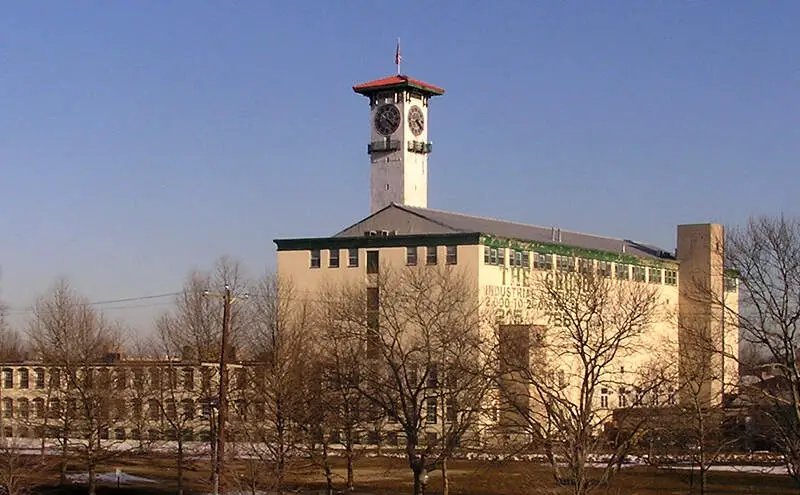
Bristol, PA Photos
Rankings for Bristol in Pennsylvania


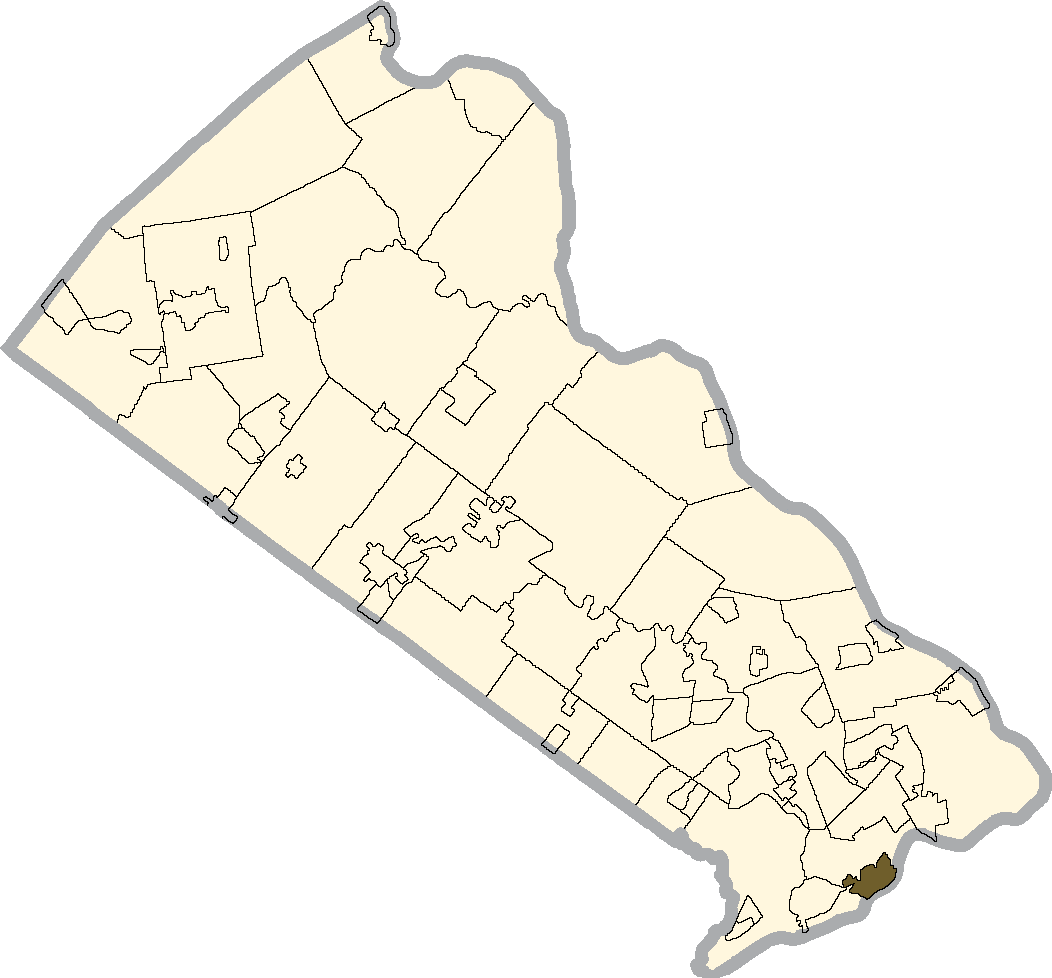
Locations Around Bristol
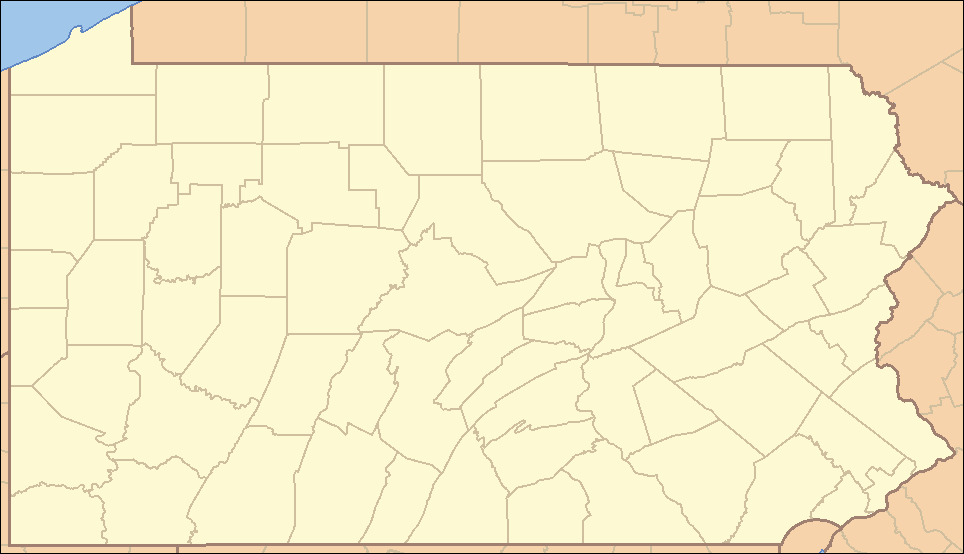
Map Of Bristol, PA
Best Places Around Bristol
Hamilton Square, NJ
Population 11,643
Yardville, NJ
Population 6,266
Mercerville, NJ
Population 13,693
White Horse, NJ
Population 10,040
Ashland, NJ
Population 9,437
Springdale, NJ
Population 15,672
Ramblewood, NJ
Population 6,542
Fort Dix, NJ
Population 8,034
Greentree, NJ
Population 11,024
Oreland, PA
Population 6,036
Bristol Demographics And Statistics
Population over time in Bristol
The current population in Bristol is 9,874. The population has increased 0.4% from 2010.
| Year | Population | % Change |
|---|---|---|
| 2023 | 9,874 | 0.1% |
| 2022 | 9,862 | 0.2% |
| 2021 | 9,847 | 2.8% |
| 2020 | 9,577 | -0.3% |
| 2019 | 9,605 | -0.1% |
| 2018 | 9,614 | -0.3% |
| 2017 | 9,645 | 0.5% |
| 2016 | 9,593 | -0.4% |
| 2015 | 9,634 | -0.2% |
| 2014 | 9,657 | -0.4% |
| 2013 | 9,699 | -0.4% |
| 2012 | 9,739 | -0.5% |
| 2011 | 9,791 | -0.4% |
| 2010 | 9,831 | - |
Race / Ethnicity in Bristol
Bristol is:
71.1% White with 7,020 White residents.
4.0% African American with 392 African American residents.
0.0% American Indian with 0 American Indian residents.
0.7% Asian with 66 Asian residents.
0.0% Hawaiian with 0 Hawaiian residents.
0.9% Other with 93 Other residents.
5.9% Two Or More with 584 Two Or More residents.
17.4% Hispanic with 1,719 Hispanic residents.
| Race | Bristol | PA | USA |
|---|---|---|---|
| White | 71.1% | 73.8% | 58.2% |
| African American | 4.0% | 10.3% | 12.0% |
| American Indian | 0.0% | 0.1% | 0.5% |
| Asian | 0.7% | 3.7% | 5.7% |
| Hawaiian | 0.0% | 0.0% | 0.2% |
| Other | 0.9% | 0.4% | 0.5% |
| Two Or More | 5.9% | 3.3% | 3.9% |
| Hispanic | 17.4% | 8.4% | 19.0% |
Gender in Bristol
Bristol is 51.2% female with 5,057 female residents.
Bristol is 48.8% male with 4,817 male residents.
| Gender | Bristol | PA | USA |
|---|---|---|---|
| Female | 51.2% | 50.7% | 50.5% |
| Male | 48.8% | 49.3% | 49.5% |
Highest level of educational attainment in Bristol for adults over 25
5.0% of adults in Bristol completed < 9th grade.
6.0% of adults in Bristol completed 9-12th grade.
36.0% of adults in Bristol completed high school / ged.
22.0% of adults in Bristol completed some college.
8.0% of adults in Bristol completed associate's degree.
14.0% of adults in Bristol completed bachelor's degree.
8.0% of adults in Bristol completed master's degree.
1.0% of adults in Bristol completed professional degree.
0.0% of adults in Bristol completed doctorate degree.
| Education | Bristol | PA | USA |
|---|---|---|---|
| < 9th Grade | 5.0% | 3.0% | 5.0% |
| 9-12th Grade | 6.0% | 5.0% | 6.0% |
| High School / GED | 36.0% | 33.0% | 26.0% |
| Some College | 22.0% | 15.0% | 19.0% |
| Associate's Degree | 8.0% | 9.0% | 9.0% |
| Bachelor's Degree | 14.0% | 21.0% | 21.0% |
| Master's Degree | 8.0% | 10.0% | 10.0% |
| Professional Degree | 1.0% | 2.0% | 2.0% |
| Doctorate Degree | 0.0% | 2.0% | 2.0% |
Household Income For Bristol, Pennsylvania
3.5% of households in Bristol earn Less than $10,000.
2.7% of households in Bristol earn $10,000 to $14,999.
5.8% of households in Bristol earn $15,000 to $24,999.
6.7% of households in Bristol earn $25,000 to $34,999.
12.5% of households in Bristol earn $35,000 to $49,999.
20.7% of households in Bristol earn $50,000 to $74,999.
11.5% of households in Bristol earn $75,000 to $99,999.
19.9% of households in Bristol earn $100,000 to $149,999.
11.2% of households in Bristol earn $150,000 to $199,999.
5.5% of households in Bristol earn $200,000 or more.
| Income | Bristol | PA | USA |
|---|---|---|---|
| Less than $10,000 | 3.5% | 4.8% | 4.9% |
| $10,000 to $14,999 | 2.7% | 3.7% | 3.6% |
| $15,000 to $24,999 | 5.8% | 7.0% | 6.6% |
| $25,000 to $34,999 | 6.7% | 7.1% | 6.8% |
| $35,000 to $49,999 | 12.5% | 10.7% | 10.4% |
| $50,000 to $74,999 | 20.7% | 16.1% | 15.7% |
| $75,000 to $99,999 | 11.5% | 12.9% | 12.7% |
| $100,000 to $149,999 | 19.9% | 17.6% | 17.4% |
| $150,000 to $199,999 | 11.2% | 9.0% | 9.3% |
| $200,000 or more | 5.5% | 11.1% | 12.6% |


