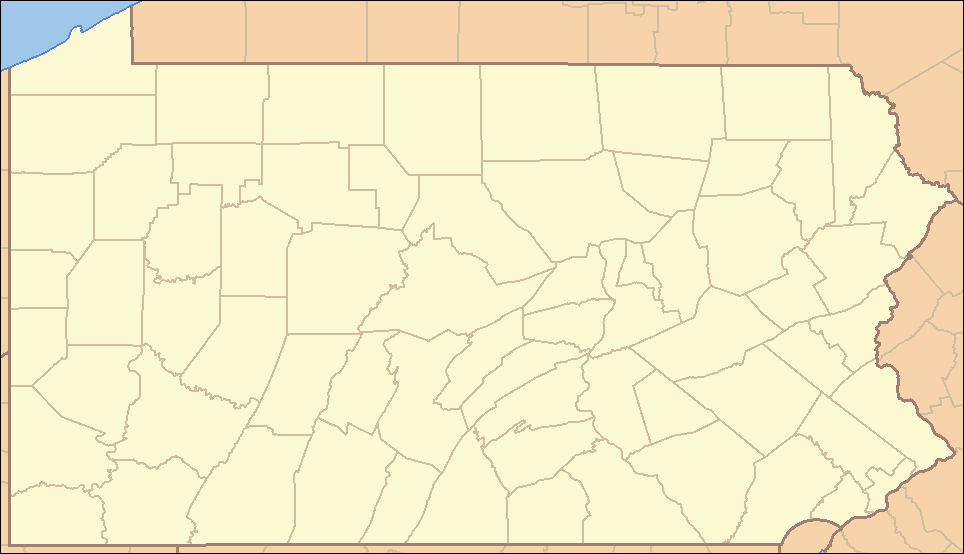

Life in Lehigh County research summary. HomeSnacks has been researching the quality of life in Lehigh County over the past eight years using Census data, FBI crime data, cost of living data, and other primary sources. Based on the most recently available data, we found the following about life in Lehigh County:
The population in Lehigh County is 374,110.
The median home value in Lehigh County is $310,307.
The median income in Lehigh County is $74,973.
The median rent in Lehigh County is $1,259.
The unemployment rate in Lehigh County is 5.8%.
The poverty rate in Lehigh County is 11.9%.
The average high in Lehigh County is 67.9° and there are 105.4 inches of rainfall annually.
The average high in Lehigh County is 67.9°.
There are 80.7 nice days each year.
Expect an average of 105.4 inches of rain each year with 12.1 inches of snow.
There is an average of 4:36 hours of sun each day in Lehigh County.
| Stat | Lehigh County |
|---|---|
| Mean High | 67.9 |
| Nice Days | 80.7 |
| Rainfall | 105.4 |
| Snowfall | 12.1 |
| Sunny_hours | 4:36 |


The current population in Lehigh County is 374,110. The population has increased 2.0% from 2019.
| Year | Population | % Change |
|---|---|---|
| 2022 | 372,492 | 1.4% |
| 2021 | 367,338 | 0.6% |
| 2020 | 365,052 | - |
Lehigh County is 50.7% female with 189,589 female residents.
Lehigh County is 49.3% male with 184,521 male residents.
| Gender | Lehigh County | PA | USA |
|---|---|---|---|
| Female | 50.7% | 50.6% | 50.4% |
| Male | 49.3% | 49.4% | 49.6% |
Lehigh County is:
60.7% White with 227,066 White residents.
5.8% African American with 21,575 African American residents.
0.1% American Indian with 203 American Indian residents.
3.3% Asian with 12,431 Asian residents.
0.0% Hawaiian with 114 Hawaiian residents.
0.3% Other with 1,223 Other residents.
2.6% Two Or More with 9,772 Two Or More residents.
27.2% Hispanic with 101,726 Hispanic residents.
| Race | Lehigh County | PA | USA |
|---|---|---|---|
| White | 60.7% | 74.5% | 58.9% |
| African American | 5.8% | 10.4% | 12.1% |
| American Indian | 0.1% | 0.1% | 0.6% |
| Asian | 3.3% | 3.6% | 5.7% |
| Hawaiian | 0.0% | 0.0% | 0.2% |
| Other | 0.3% | 0.4% | 0.4% |
| Two Or More | 2.6% | 3.0% | 3.5% |
| Hispanic | 27.2% | 8.1% | 18.7% |
3.5% of households in Lehigh County earn Less than $10,000.
3.3% of households in Lehigh County earn $10,000 to $14,999.
7.1% of households in Lehigh County earn $15,000 to $24,999.
7.9% of households in Lehigh County earn $25,000 to $34,999.
11.4% of households in Lehigh County earn $35,000 to $49,999.
16.9% of households in Lehigh County earn $50,000 to $74,999.
13.1% of households in Lehigh County earn $75,000 to $99,999.
16.9% of households in Lehigh County earn $100,000 to $149,999.
9.8% of households in Lehigh County earn $150,000 to $199,999.
10.3% of households in Lehigh County earn $200,000 or more.
| Income | Lehigh County | PA | USA |
|---|---|---|---|
| Less than $10,000 | 3.5% | 4.8% | 4.9% |
| $10,000 to $14,999 | 3.3% | 3.9% | 3.8% |
| $15,000 to $24,999 | 7.1% | 7.4% | 7.0% |
| $25,000 to $34,999 | 7.9% | 7.6% | 7.4% |
| $35,000 to $49,999 | 11.4% | 11.0% | 10.7% |
| $50,000 to $74,999 | 16.9% | 16.3% | 16.1% |
| $75,000 to $99,999 | 13.1% | 13.0% | 12.8% |
| $100,000 to $149,999 | 16.9% | 17.2% | 17.1% |
| $150,000 to $199,999 | 9.8% | 8.5% | 8.8% |
| $200,000 or more | 10.3% | 10.2% | 11.4% |
4.0% of adults in Lehigh County completed < 9th grade.
6.0% of adults in Lehigh County completed 9-12th grade.
32.0% of adults in Lehigh County completed high school / ged.
16.0% of adults in Lehigh County completed some college.
9.0% of adults in Lehigh County completed associate's degree.
20.0% of adults in Lehigh County completed bachelor's degree.
9.0% of adults in Lehigh County completed master's degree.
2.0% of adults in Lehigh County completed professional degree.
2.0% of adults in Lehigh County completed doctorate degree.
| Education | Lehigh County | PA | USA |
|---|---|---|---|
| < 9th Grade | 4% | 2% | 3% |
| 9-12th Grade | 6% | 5% | 6% |
| High School / GED | 32% | 34% | 26% |
| Some College | 16% | 16% | 20% |
| Associate's Degree | 9% | 9% | 9% |
| Bachelor's Degree | 20% | 20% | 21% |
| Master's Degree | 9% | 10% | 10% |
| Professional Degree | 2% | 2% | 2% |
| Doctorate Degree | 2% | 2% | 2% |
HomeSnacks is based in Durham, NC.
We aim to deliver bite-sized pieces of infotainment about where you live.
We use data, analytics, and a sense of humor to determine quality of life for places across the nation.