New Kensington, PA
Demographics And Statistics
Living In New Kensington, Pennsylvania Summary
Life in New Kensington research summary. HomeSnacks has been using Saturday Night Science to research the quality of life in New Kensington over the past nine years using Census, FBI, Zillow, and other primary data sources. Based on the most recently available data, we found the following about life in New Kensington:
The population in New Kensington is 12,072.
The median home value in New Kensington is $177,069.
The median income in New Kensington is $49,644.
The cost of living in New Kensington is 89 which is 0.9x lower than the national average.
The median rent in New Kensington is $694.
The unemployment rate in New Kensington is 5.0%.
The poverty rate in New Kensington is 16.9%.
The average high in New Kensington is 61.6° and the average low is 40.6°.
New Kensington SnackAbility
Overall SnackAbility
New Kensington, PA Crime Report
Crime in New Kensington summary. We use data from the FBI to determine the crime rates in New Kensington. Key points include:
There were 338 total crimes in New Kensington in the last reporting year.
The overall crime rate per 100,000 people in New Kensington is 2,856.7 / 100k people.
The violent crime rate per 100,000 people in New Kensington is 456.4 / 100k people.
The property crime rate per 100,000 people in New Kensington is 2,400.3 / 100k people.
Overall, crime in New Kensington is 34.80% above the national average.
Total Crimes
Above National Average
Crime In New Kensington Comparison Table
| Statistic | Count Raw |
New Kensington / 100k People |
Pennsylvania / 100k People |
National / 100k People |
|---|---|---|---|---|
| Total Crimes Per 100K | 338 | 2,856.7 | 1,680.6 | 2,119.2 |
| Violent Crime | 54 | 456.4 | 245.6 | 359.0 |
| Murder | 1 | 8.5 | 5.0 | 5.0 |
| Robbery | 8 | 67.6 | 51.4 | 61.0 |
| Aggravated Assault | 42 | 355.0 | 161.4 | 256.0 |
| Property Crime | 284 | 2,400.3 | 1,435.0 | 1,760.0 |
| Burglary | 44 | 371.9 | 116.7 | 229.0 |
| Larceny | 220 | 1,859.4 | 1,129.8 | 1,272.0 |
| Car Theft | 20 | 169.0 | 188.5 | 259.0 |
New Kensington, PA Cost Of Living
Cost of living in New Kensington summary. We use data on the cost of living to determine how expensive it is to live in New Kensington. Real estate prices drive most of the variance in cost of living around Pennsylvania. Key points include:
The cost of living in New Kensington is 89 with 100 being average.
The cost of living in New Kensington is 0.9x lower than the national average.
The median home value in New Kensington is $177,069.
The median income in New Kensington is $49,644.
New Kensington's Overall Cost Of Living
Lower Than The National Average
Cost Of Living In New Kensington Comparison Table
| Living Expense | New Kensington | Pennsylvania | National Average | |
|---|---|---|---|---|
| Overall | 89 | 100 | 100 | |
| Services | 92 | 101 | 100 | |
| Groceries | 101 | 101 | 100 | |
| Health | 89 | 95 | 100 | |
| Housing | 61 | 93 | 100 | |
| Transportation | 107 | 108 | 100 | |
| Utilities | 123 | 108 | 100 | |
New Kensington, PA Weather
The average high in New Kensington is 61.6° and the average low is 40.6°.
There are 83.1 days of precipitation each year.
Expect an average of 40.2 inches of precipitation each year with 28.0 inches of snow.
| Stat | New Kensington |
|---|---|
| Average Annual High | 61.6 |
| Average Annual Low | 40.6 |
| Annual Precipitation Days | 83.1 |
| Average Annual Precipitation | 40.2 |
| Average Annual Snowfall | 28.0 |
Average High
Days of Rain
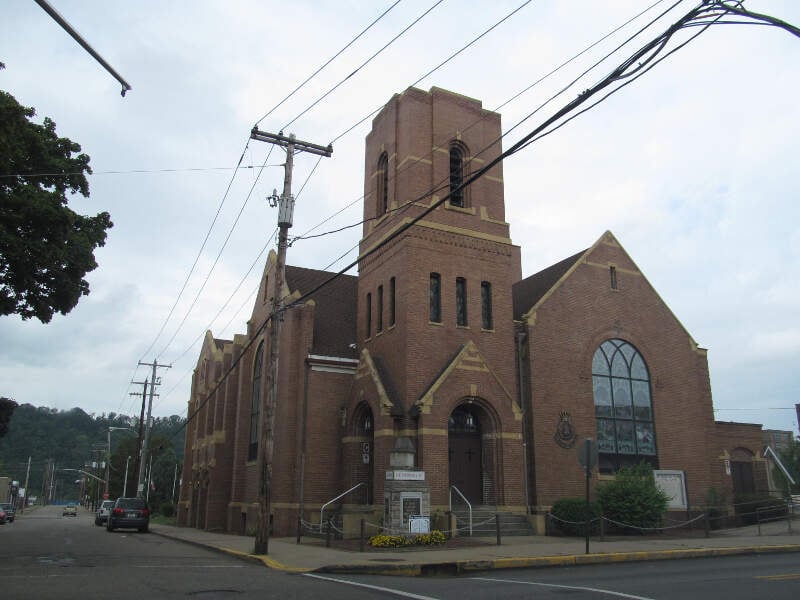
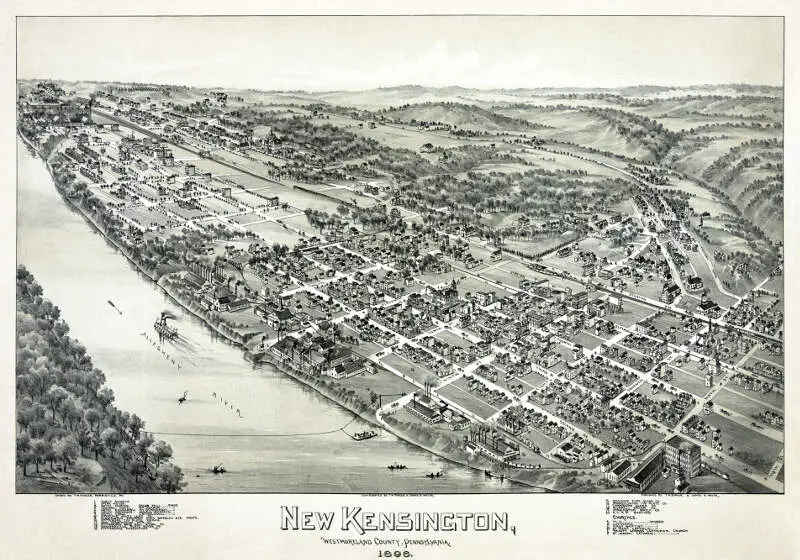
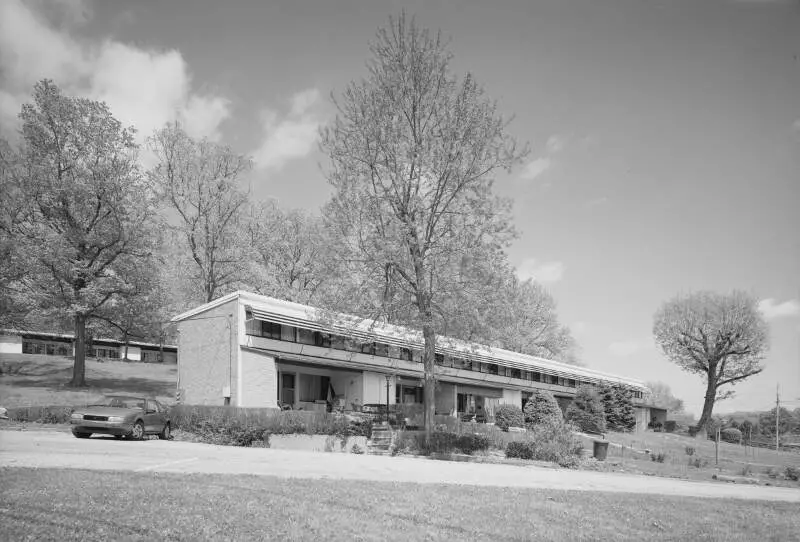
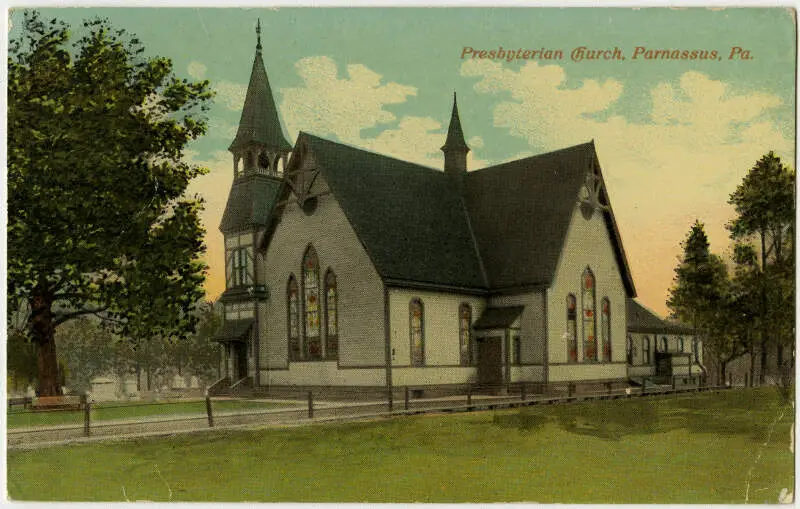
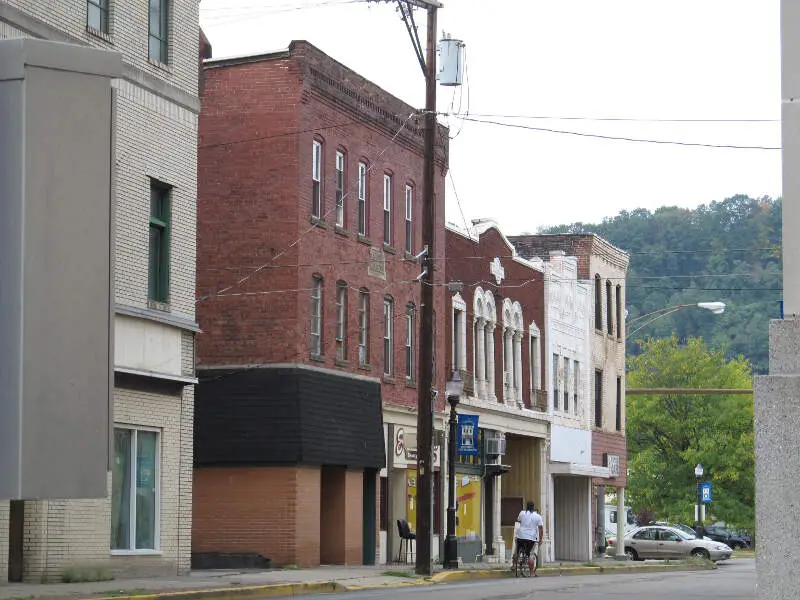
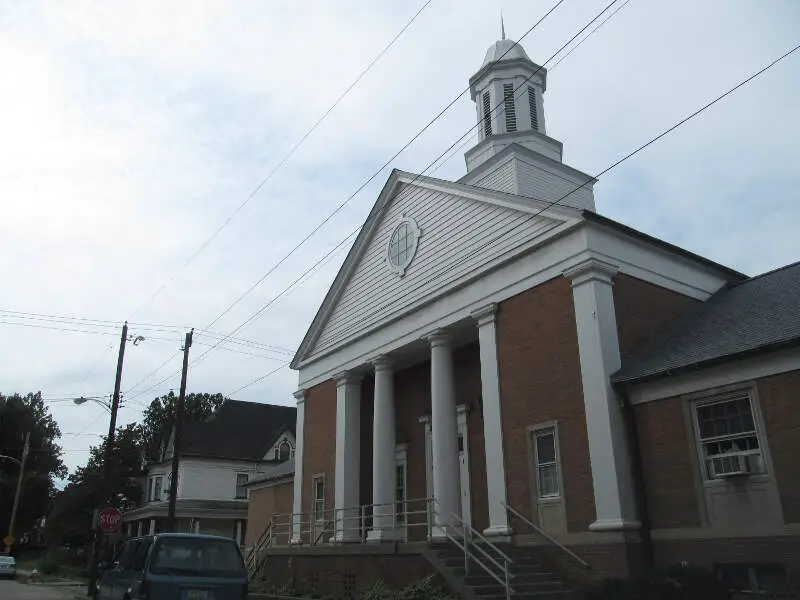
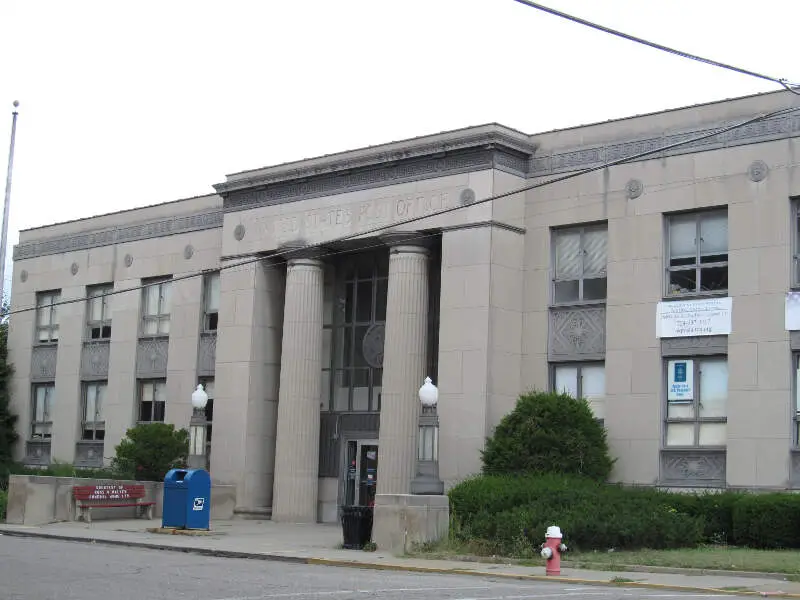
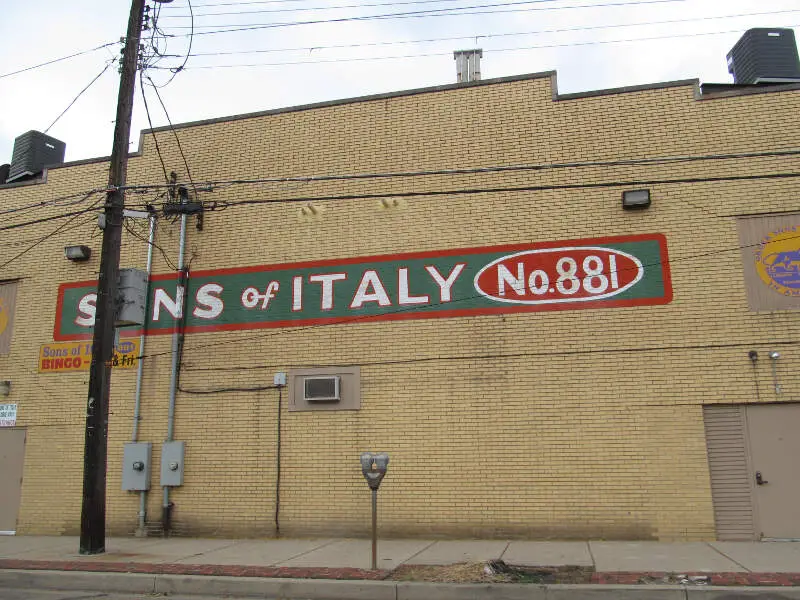
New Kensington, PA Photos

Rankings for New Kensington in Pennsylvania


Locations Around New Kensington
Map Of New Kensington, PA
Best Places Around New Kensington
Fox Chapel, PA
Population 5,264
Glenshaw, PA
Population 9,194
Franklin Park, PA
Population 15,273
Allison Park, PA
Population 22,108
Pleasant Hills, PA
Population 8,418
Forest Hills, PA
Population 6,332
Dormont, PA
Population 8,120
Castle Shannon, PA
Population 8,237
Whitehall, PA
Population 14,863
West View, PA
Population 6,582
New Kensington Demographics And Statistics
Population over time in New Kensington
The current population in New Kensington is 12,072. The population has decreased -9.7% from 2010.
| Year | Population | % Change |
|---|---|---|
| 2023 | 12,072 | -0.7% |
| 2022 | 12,163 | -0.5% |
| 2021 | 12,222 | -1.3% |
| 2020 | 12,378 | -0.7% |
| 2019 | 12,468 | -0.8% |
| 2018 | 12,568 | -0.9% |
| 2017 | 12,679 | -0.9% |
| 2016 | 12,793 | -0.6% |
| 2015 | 12,874 | -0.7% |
| 2014 | 12,959 | -0.7% |
| 2013 | 13,050 | -0.8% |
| 2012 | 13,157 | -0.8% |
| 2011 | 13,257 | -0.9% |
| 2010 | 13,372 | - |
Race / Ethnicity in New Kensington
New Kensington is:
81.7% White with 9,862 White residents.
12.2% African American with 1,472 African American residents.
0.0% American Indian with 1 American Indian residents.
0.6% Asian with 71 Asian residents.
0.0% Hawaiian with 0 Hawaiian residents.
0.2% Other with 29 Other residents.
3.7% Two Or More with 449 Two Or More residents.
1.6% Hispanic with 188 Hispanic residents.
| Race | New Kensington | PA | USA |
|---|---|---|---|
| White | 81.7% | 73.8% | 58.2% |
| African American | 12.2% | 10.3% | 12.0% |
| American Indian | 0.0% | 0.1% | 0.5% |
| Asian | 0.6% | 3.7% | 5.7% |
| Hawaiian | 0.0% | 0.0% | 0.2% |
| Other | 0.2% | 0.4% | 0.5% |
| Two Or More | 3.7% | 3.3% | 3.9% |
| Hispanic | 1.6% | 8.4% | 19.0% |
Gender in New Kensington
New Kensington is 49.9% female with 6,024 female residents.
New Kensington is 50.1% male with 6,047 male residents.
| Gender | New Kensington | PA | USA |
|---|---|---|---|
| Female | 49.9% | 50.7% | 50.5% |
| Male | 50.1% | 49.3% | 49.5% |
Highest level of educational attainment in New Kensington for adults over 25
2.0% of adults in New Kensington completed < 9th grade.
2.0% of adults in New Kensington completed 9-12th grade.
41.0% of adults in New Kensington completed high school / ged.
21.0% of adults in New Kensington completed some college.
13.0% of adults in New Kensington completed associate's degree.
14.0% of adults in New Kensington completed bachelor's degree.
5.0% of adults in New Kensington completed master's degree.
1.0% of adults in New Kensington completed professional degree.
1.0% of adults in New Kensington completed doctorate degree.
| Education | New Kensington | PA | USA |
|---|---|---|---|
| < 9th Grade | 2.0% | 3.0% | 5.0% |
| 9-12th Grade | 2.0% | 5.0% | 6.0% |
| High School / GED | 41.0% | 33.0% | 26.0% |
| Some College | 21.0% | 15.0% | 19.0% |
| Associate's Degree | 13.0% | 9.0% | 9.0% |
| Bachelor's Degree | 14.0% | 21.0% | 21.0% |
| Master's Degree | 5.0% | 10.0% | 10.0% |
| Professional Degree | 1.0% | 2.0% | 2.0% |
| Doctorate Degree | 1.0% | 2.0% | 2.0% |
Household Income For New Kensington, Pennsylvania
6.7% of households in New Kensington earn Less than $10,000.
7.7% of households in New Kensington earn $10,000 to $14,999.
14.5% of households in New Kensington earn $15,000 to $24,999.
7.8% of households in New Kensington earn $25,000 to $34,999.
13.8% of households in New Kensington earn $35,000 to $49,999.
16.6% of households in New Kensington earn $50,000 to $74,999.
12.5% of households in New Kensington earn $75,000 to $99,999.
15.3% of households in New Kensington earn $100,000 to $149,999.
2.5% of households in New Kensington earn $150,000 to $199,999.
2.5% of households in New Kensington earn $200,000 or more.
| Income | New Kensington | PA | USA |
|---|---|---|---|
| Less than $10,000 | 6.7% | 4.8% | 4.9% |
| $10,000 to $14,999 | 7.7% | 3.7% | 3.6% |
| $15,000 to $24,999 | 14.5% | 7.0% | 6.6% |
| $25,000 to $34,999 | 7.8% | 7.1% | 6.8% |
| $35,000 to $49,999 | 13.8% | 10.7% | 10.4% |
| $50,000 to $74,999 | 16.6% | 16.1% | 15.7% |
| $75,000 to $99,999 | 12.5% | 12.9% | 12.7% |
| $100,000 to $149,999 | 15.3% | 17.6% | 17.4% |
| $150,000 to $199,999 | 2.5% | 9.0% | 9.3% |
| $200,000 or more | 2.5% | 11.1% | 12.6% |


