Punxsutawney, PA
Demographics And Statistics
Living In Punxsutawney, Pennsylvania Summary
Life in Punxsutawney research summary. HomeSnacks has been using Saturday Night Science to research the quality of life in Punxsutawney over the past nine years using Census, FBI, Zillow, and other primary data sources. Based on the most recently available data, we found the following about life in Punxsutawney:
The population in Punxsutawney is 5,689.
The median home value in Punxsutawney is $120,682.
The median income in Punxsutawney is $43,097.
The cost of living in Punxsutawney is 89 which is 0.9x lower than the national average.
The median rent in Punxsutawney is $796.
The unemployment rate in Punxsutawney is 4.3%.
The poverty rate in Punxsutawney is 21.4%.
The average high in Punxsutawney is 59.0° and the average low is 37.6°.
Table Of Contents
Punxsutawney SnackAbility
Overall SnackAbility
Punxsutawney, PA Cost Of Living
Cost of living in Punxsutawney summary. We use data on the cost of living to determine how expensive it is to live in Punxsutawney. Real estate prices drive most of the variance in cost of living around Pennsylvania. Key points include:
The cost of living in Punxsutawney is 89 with 100 being average.
The cost of living in Punxsutawney is 0.9x lower than the national average.
The median home value in Punxsutawney is $120,682.
The median income in Punxsutawney is $43,097.
Punxsutawney's Overall Cost Of Living
Lower Than The National Average
Cost Of Living In Punxsutawney Comparison Table
| Living Expense | Punxsutawney | Pennsylvania | National Average | |
|---|---|---|---|---|
| Overall | 89 | 100 | 100 | |
| Services | 92 | 101 | 100 | |
| Groceries | 100 | 101 | 100 | |
| Health | 90 | 95 | 100 | |
| Housing | 53 | 93 | 100 | |
| Transportation | 108 | 108 | 100 | |
| Utilities | 127 | 108 | 100 | |
Punxsutawney, PA Weather
The average high in Punxsutawney is 59.0° and the average low is 37.6°.
There are 93.0 days of precipitation each year.
Expect an average of 43.8 inches of precipitation each year with 52.5 inches of snow.
| Stat | Punxsutawney |
|---|---|
| Average Annual High | 59.0 |
| Average Annual Low | 37.6 |
| Annual Precipitation Days | 93.0 |
| Average Annual Precipitation | 43.8 |
| Average Annual Snowfall | 52.5 |
Average High
Days of Rain
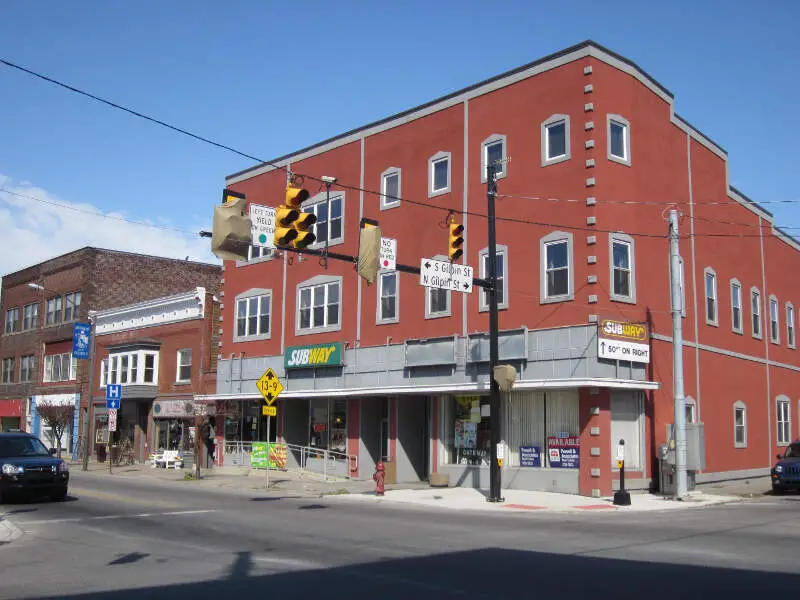
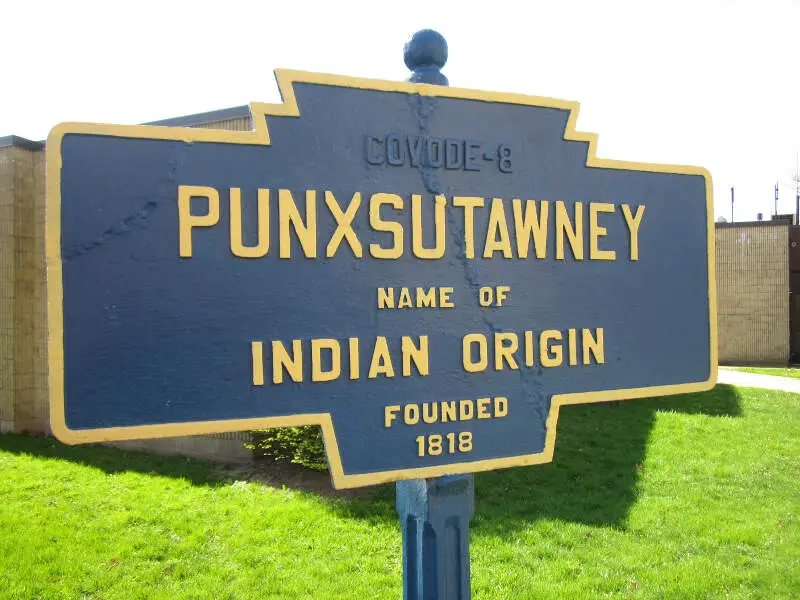
Punxsutawney, PA Photos


Rankings for Punxsutawney in Pennsylvania


Locations Around Punxsutawney
Map Of Punxsutawney, PA
Best Places Around Punxsutawney
Shanor-Northvue, PA
Population 5,183
Indiana, PA
Population 14,170
Westmont, PA
Population 4,893
Hollidaysburg, PA
Population 5,581
St. Marys, PA
Population 12,612
Homeacre-Lyndora, PA
Population 6,647
Lower Burrell, PA
Population 11,659
Vandergrift, PA
Population 5,028
New Kensington, PA
Population 12,072
Punxsutawney Demographics And Statistics
Population over time in Punxsutawney
The current population in Punxsutawney is 5,689. The population has decreased -5.6% from 2010.
| Year | Population | % Change |
|---|---|---|
| 2023 | 5,689 | -0.7% |
| 2022 | 5,730 | -1.1% |
| 2021 | 5,793 | 0.8% |
| 2020 | 5,747 | -0.4% |
| 2019 | 5,770 | -0.7% |
| 2018 | 5,808 | -0.7% |
| 2017 | 5,848 | -0.6% |
| 2016 | 5,883 | -0.3% |
| 2015 | 5,899 | -0.5% |
| 2014 | 5,927 | -0.3% |
| 2013 | 5,946 | -0.3% |
| 2012 | 5,965 | -0.5% |
| 2011 | 5,992 | -0.5% |
| 2010 | 6,025 | - |
Race / Ethnicity in Punxsutawney
Punxsutawney is:
97.9% White with 5,571 White residents.
0.4% African American with 20 African American residents.
0.0% American Indian with 0 American Indian residents.
0.0% Asian with 0 Asian residents.
0.0% Hawaiian with 0 Hawaiian residents.
0.0% Other with 0 Other residents.
1.0% Two Or More with 56 Two Or More residents.
0.7% Hispanic with 42 Hispanic residents.
| Race | Punxsutawney | PA | USA |
|---|---|---|---|
| White | 97.9% | 73.8% | 58.2% |
| African American | 0.4% | 10.3% | 12.0% |
| American Indian | 0.0% | 0.1% | 0.5% |
| Asian | 0.0% | 3.7% | 5.7% |
| Hawaiian | 0.0% | 0.0% | 0.2% |
| Other | 0.0% | 0.4% | 0.5% |
| Two Or More | 1.0% | 3.3% | 3.9% |
| Hispanic | 0.7% | 8.4% | 19.0% |
Gender in Punxsutawney
Punxsutawney is 53.7% female with 3,054 female residents.
Punxsutawney is 46.3% male with 2,635 male residents.
| Gender | Punxsutawney | PA | USA |
|---|---|---|---|
| Female | 53.7% | 50.7% | 50.5% |
| Male | 46.3% | 49.3% | 49.5% |
Highest level of educational attainment in Punxsutawney for adults over 25
1.0% of adults in Punxsutawney completed < 9th grade.
4.0% of adults in Punxsutawney completed 9-12th grade.
50.0% of adults in Punxsutawney completed high school / ged.
16.0% of adults in Punxsutawney completed some college.
9.0% of adults in Punxsutawney completed associate's degree.
14.0% of adults in Punxsutawney completed bachelor's degree.
5.0% of adults in Punxsutawney completed master's degree.
1.0% of adults in Punxsutawney completed professional degree.
0.0% of adults in Punxsutawney completed doctorate degree.
| Education | Punxsutawney | PA | USA |
|---|---|---|---|
| < 9th Grade | 1.0% | 3.0% | 5.0% |
| 9-12th Grade | 4.0% | 5.0% | 6.0% |
| High School / GED | 50.0% | 33.0% | 26.0% |
| Some College | 16.0% | 15.0% | 19.0% |
| Associate's Degree | 9.0% | 9.0% | 9.0% |
| Bachelor's Degree | 14.0% | 21.0% | 21.0% |
| Master's Degree | 5.0% | 10.0% | 10.0% |
| Professional Degree | 1.0% | 2.0% | 2.0% |
| Doctorate Degree | 0.0% | 2.0% | 2.0% |
Household Income For Punxsutawney, Pennsylvania
10.4% of households in Punxsutawney earn Less than $10,000.
6.5% of households in Punxsutawney earn $10,000 to $14,999.
14.8% of households in Punxsutawney earn $15,000 to $24,999.
9.0% of households in Punxsutawney earn $25,000 to $34,999.
18.3% of households in Punxsutawney earn $35,000 to $49,999.
14.3% of households in Punxsutawney earn $50,000 to $74,999.
9.5% of households in Punxsutawney earn $75,000 to $99,999.
9.2% of households in Punxsutawney earn $100,000 to $149,999.
3.2% of households in Punxsutawney earn $150,000 to $199,999.
4.9% of households in Punxsutawney earn $200,000 or more.
| Income | Punxsutawney | PA | USA |
|---|---|---|---|
| Less than $10,000 | 10.4% | 4.8% | 4.9% |
| $10,000 to $14,999 | 6.5% | 3.7% | 3.6% |
| $15,000 to $24,999 | 14.8% | 7.0% | 6.6% |
| $25,000 to $34,999 | 9.0% | 7.1% | 6.8% |
| $35,000 to $49,999 | 18.3% | 10.7% | 10.4% |
| $50,000 to $74,999 | 14.3% | 16.1% | 15.7% |
| $75,000 to $99,999 | 9.5% | 12.9% | 12.7% |
| $100,000 to $149,999 | 9.2% | 17.6% | 17.4% |
| $150,000 to $199,999 | 3.2% | 9.0% | 9.3% |
| $200,000 or more | 4.9% | 11.1% | 12.6% |


