Vandergrift, PA
Demographics And Statistics
Living In Vandergrift, Pennsylvania Summary
Life in Vandergrift research summary. HomeSnacks has been using Saturday Night Science to research the quality of life in Vandergrift over the past nine years using Census, FBI, Zillow, and other primary data sources. Based on the most recently available data, we found the following about life in Vandergrift:
The population in Vandergrift is 5,028.
The median home value in Vandergrift is $109,445.
The median income in Vandergrift is $50,351.
The median rent in Vandergrift is $793.
The unemployment rate in Vandergrift is 11.1%.
The poverty rate in Vandergrift is 24.9%.
The average high in Vandergrift is 61.7° and the average low is 40.1°.
Table Of Contents
Vandergrift SnackAbility
Overall SnackAbility
Vandergrift, PA Crime Report
Crime in Vandergrift summary. We use data from the FBI to determine the crime rates in Vandergrift. Key points include:
There were 29 total crimes in Vandergrift in the last reporting year.
The overall crime rate per 100,000 people in Vandergrift is 585.3 / 100k people.
The violent crime rate per 100,000 people in Vandergrift is 201.8 / 100k people.
The property crime rate per 100,000 people in Vandergrift is 383.5 / 100k people.
Overall, crime in Vandergrift is -72.38% below the national average.
Total Crimes
Below National Average
Crime In Vandergrift Comparison Table
| Statistic | Count Raw |
Vandergrift / 100k People |
Pennsylvania / 100k People |
National / 100k People |
|---|---|---|---|---|
| Total Crimes Per 100K | 29 | 585.3 | 1,680.6 | 2,119.2 |
| Violent Crime | 10 | 201.8 | 245.6 | 359.0 |
| Murder | 0 | 0.0 | 5.0 | 5.0 |
| Robbery | 2 | 40.4 | 51.4 | 61.0 |
| Aggravated Assault | 8 | 161.5 | 161.4 | 256.0 |
| Property Crime | 19 | 383.5 | 1,435.0 | 1,760.0 |
| Burglary | 3 | 60.5 | 116.7 | 229.0 |
| Larceny | 16 | 322.9 | 1,129.8 | 1,272.0 |
| Car Theft | 0 | 0.0 | 188.5 | 259.0 |
Vandergrift, PA Weather
The average high in Vandergrift is 61.7° and the average low is 40.1°.
There are 85.7 days of precipitation each year.
Expect an average of 40.2 inches of precipitation each year with 28.2 inches of snow.
| Stat | Vandergrift |
|---|---|
| Average Annual High | 61.7 |
| Average Annual Low | 40.1 |
| Annual Precipitation Days | 85.7 |
| Average Annual Precipitation | 40.2 |
| Average Annual Snowfall | 28.2 |
Average High
Days of Rain
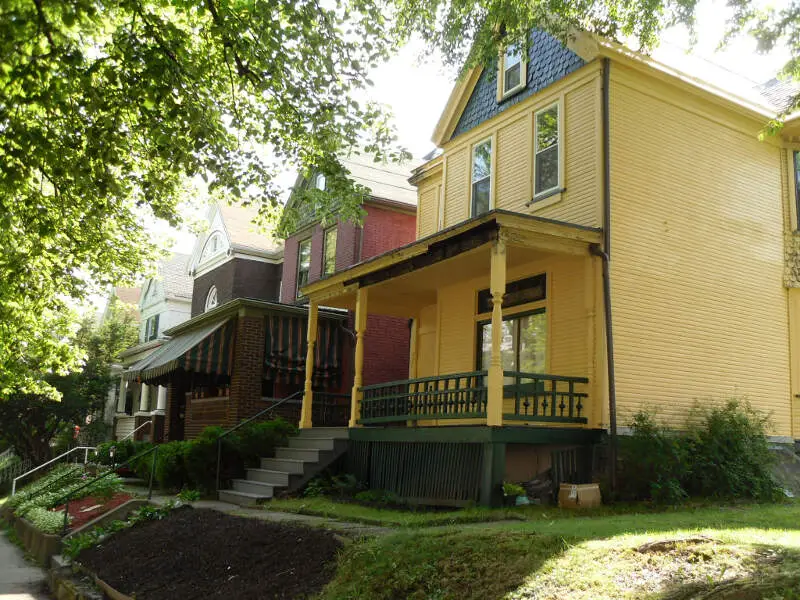
Vandergrift, PA Photos
Rankings for Vandergrift in Pennsylvania


Locations Around Vandergrift
Map Of Vandergrift, PA
Best Places Around Vandergrift
Fox Chapel, PA
Population 5,264
Forest Hills, PA
Population 6,332
Oakmont, PA
Population 6,712
Plum, PA
Population 26,873
Turtle Creek, PA
Population 5,046
Wilkinsburg, PA
Population 14,165
Jeannette, PA
Population 8,719
Lower Burrell, PA
Population 11,659
Greensburg, PA
Population 14,777
New Kensington, PA
Population 12,072
Vandergrift Demographics And Statistics
Population over time in Vandergrift
The current population in Vandergrift is 5,028. The population has decreased -4.6% from 2010.
| Year | Population | % Change |
|---|---|---|
| 2023 | 5,028 | -0.5% |
| 2022 | 5,051 | -0.3% |
| 2021 | 5,065 | 3.1% |
| 2020 | 4,914 | -0.7% |
| 2019 | 4,950 | -0.7% |
| 2018 | 4,987 | -1.0% |
| 2017 | 5,037 | -0.5% |
| 2016 | 5,063 | -0.6% |
| 2015 | 5,095 | -0.9% |
| 2014 | 5,142 | -0.6% |
| 2013 | 5,175 | -0.4% |
| 2012 | 5,197 | -0.5% |
| 2011 | 5,223 | -0.9% |
| 2010 | 5,269 | - |
Race / Ethnicity in Vandergrift
Vandergrift is:
87.2% White with 4,386 White residents.
2.4% African American with 121 African American residents.
0.0% American Indian with 0 American Indian residents.
0.0% Asian with 1 Asian residents.
0.0% Hawaiian with 0 Hawaiian residents.
0.0% Other with 0 Other residents.
7.6% Two Or More with 382 Two Or More residents.
2.7% Hispanic with 138 Hispanic residents.
| Race | Vandergrift | PA | USA |
|---|---|---|---|
| White | 87.2% | 73.8% | 58.2% |
| African American | 2.4% | 10.3% | 12.0% |
| American Indian | 0.0% | 0.1% | 0.5% |
| Asian | 0.0% | 3.7% | 5.7% |
| Hawaiian | 0.0% | 0.0% | 0.2% |
| Other | 0.0% | 0.4% | 0.5% |
| Two Or More | 7.6% | 3.3% | 3.9% |
| Hispanic | 2.7% | 8.4% | 19.0% |
Gender in Vandergrift
Vandergrift is 53.8% female with 2,703 female residents.
Vandergrift is 46.2% male with 2,325 male residents.
| Gender | Vandergrift | PA | USA |
|---|---|---|---|
| Female | 53.8% | 50.7% | 50.5% |
| Male | 46.2% | 49.3% | 49.5% |
Highest level of educational attainment in Vandergrift for adults over 25
2.0% of adults in Vandergrift completed < 9th grade.
5.0% of adults in Vandergrift completed 9-12th grade.
43.0% of adults in Vandergrift completed high school / ged.
20.0% of adults in Vandergrift completed some college.
15.0% of adults in Vandergrift completed associate's degree.
11.0% of adults in Vandergrift completed bachelor's degree.
3.0% of adults in Vandergrift completed master's degree.
0.0% of adults in Vandergrift completed professional degree.
1.0% of adults in Vandergrift completed doctorate degree.
| Education | Vandergrift | PA | USA |
|---|---|---|---|
| < 9th Grade | 2.0% | 3.0% | 5.0% |
| 9-12th Grade | 5.0% | 5.0% | 6.0% |
| High School / GED | 43.0% | 33.0% | 26.0% |
| Some College | 20.0% | 15.0% | 19.0% |
| Associate's Degree | 15.0% | 9.0% | 9.0% |
| Bachelor's Degree | 11.0% | 21.0% | 21.0% |
| Master's Degree | 3.0% | 10.0% | 10.0% |
| Professional Degree | 0.0% | 2.0% | 2.0% |
| Doctorate Degree | 1.0% | 2.0% | 2.0% |
Household Income For Vandergrift, Pennsylvania
5.1% of households in Vandergrift earn Less than $10,000.
7.0% of households in Vandergrift earn $10,000 to $14,999.
10.6% of households in Vandergrift earn $15,000 to $24,999.
12.5% of households in Vandergrift earn $25,000 to $34,999.
13.4% of households in Vandergrift earn $35,000 to $49,999.
25.5% of households in Vandergrift earn $50,000 to $74,999.
11.4% of households in Vandergrift earn $75,000 to $99,999.
12.3% of households in Vandergrift earn $100,000 to $149,999.
1.8% of households in Vandergrift earn $150,000 to $199,999.
0.4% of households in Vandergrift earn $200,000 or more.
| Income | Vandergrift | PA | USA |
|---|---|---|---|
| Less than $10,000 | 5.1% | 4.8% | 4.9% |
| $10,000 to $14,999 | 7.0% | 3.7% | 3.6% |
| $15,000 to $24,999 | 10.6% | 7.0% | 6.6% |
| $25,000 to $34,999 | 12.5% | 7.1% | 6.8% |
| $35,000 to $49,999 | 13.4% | 10.7% | 10.4% |
| $50,000 to $74,999 | 25.5% | 16.1% | 15.7% |
| $75,000 to $99,999 | 11.4% | 12.9% | 12.7% |
| $100,000 to $149,999 | 12.3% | 17.6% | 17.4% |
| $150,000 to $199,999 | 1.8% | 9.0% | 9.3% |
| $200,000 or more | 0.4% | 11.1% | 12.6% |


