Washington, PA
Demographics And Statistics
Living In Washington, Pennsylvania Summary
Life in Washington research summary. HomeSnacks has been using Saturday Night Science to research the quality of life in Washington over the past nine years using Census, FBI, Zillow, and other primary data sources. Based on the most recently available data, we found the following about life in Washington:
The population in Washington is 13,361.
The median home value in Washington is $235,204.
The median income in Washington is $52,350.
The cost of living in Washington is 90 which is 0.9x lower than the national average.
The median rent in Washington is $895.
The unemployment rate in Washington is 7.9%.
The poverty rate in Washington is 16.2%.
The average high in Washington is 61.3° and the average low is 39.5°.
Table Of Contents
Washington SnackAbility
Overall SnackAbility
Washington, PA Cost Of Living
Cost of living in Washington summary. We use data on the cost of living to determine how expensive it is to live in Washington. Real estate prices drive most of the variance in cost of living around Pennsylvania. Key points include:
The cost of living in Washington is 90 with 100 being average.
The cost of living in Washington is 0.9x lower than the national average.
The median home value in Washington is $235,204.
The median income in Washington is $52,350.
Washington's Overall Cost Of Living
Lower Than The National Average
Cost Of Living In Washington Comparison Table
| Living Expense | Washington | Pennsylvania | National Average | |
|---|---|---|---|---|
| Overall | 90 | 100 | 100 | |
| Services | 93 | 101 | 100 | |
| Groceries | 102 | 101 | 100 | |
| Health | 91 | 95 | 100 | |
| Housing | 62 | 93 | 100 | |
| Transportation | 106 | 108 | 100 | |
| Utilities | 126 | 108 | 100 | |
Washington, PA Weather
The average high in Washington is 61.3° and the average low is 39.5°.
There are 103.5 days of precipitation each year.
Expect an average of 39.2 inches of precipitation each year with 30.6 inches of snow.
| Stat | Washington |
|---|---|
| Average Annual High | 61.3 |
| Average Annual Low | 39.5 |
| Annual Precipitation Days | 103.5 |
| Average Annual Precipitation | 39.2 |
| Average Annual Snowfall | 30.6 |
Average High
Days of Rain
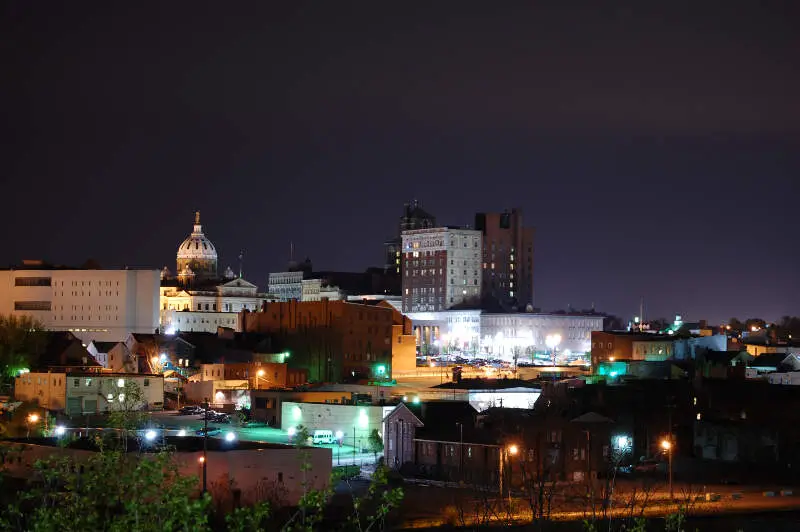
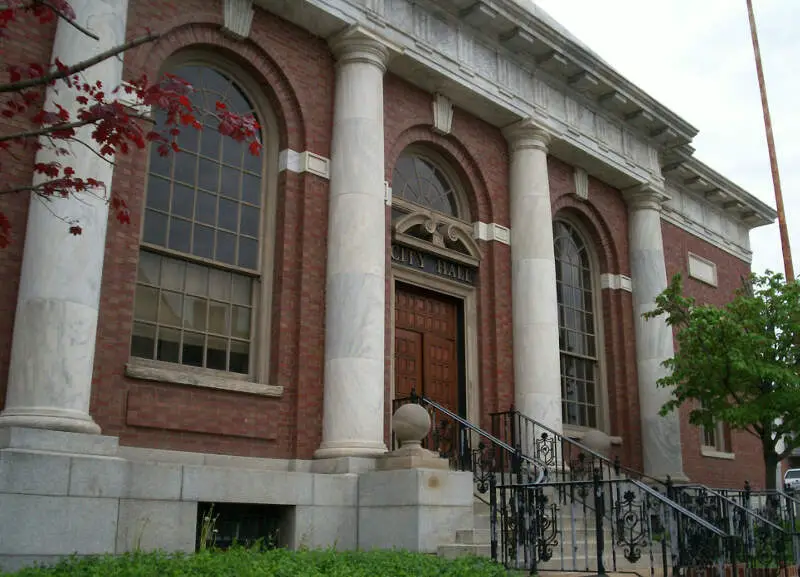
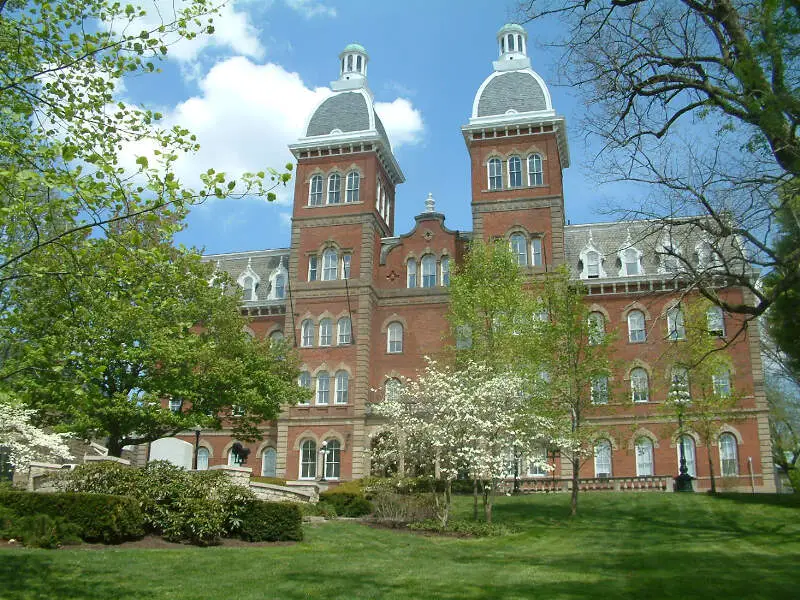
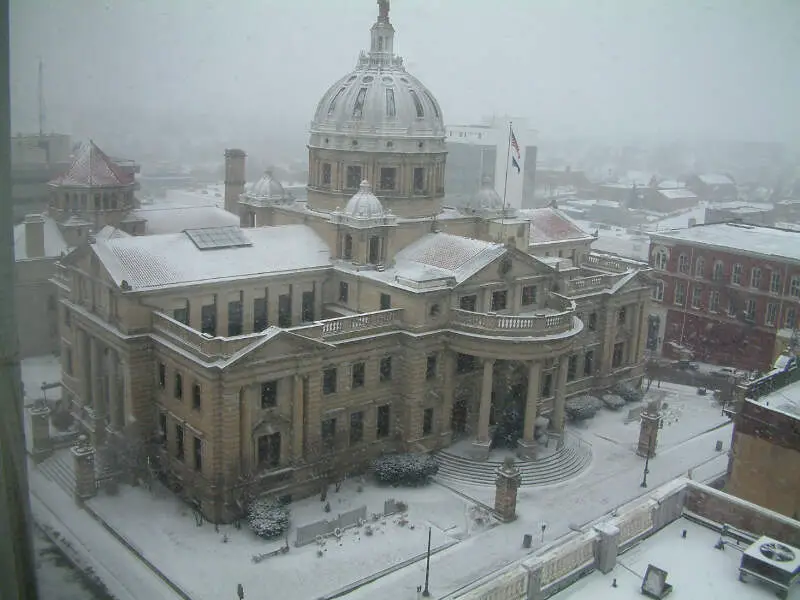
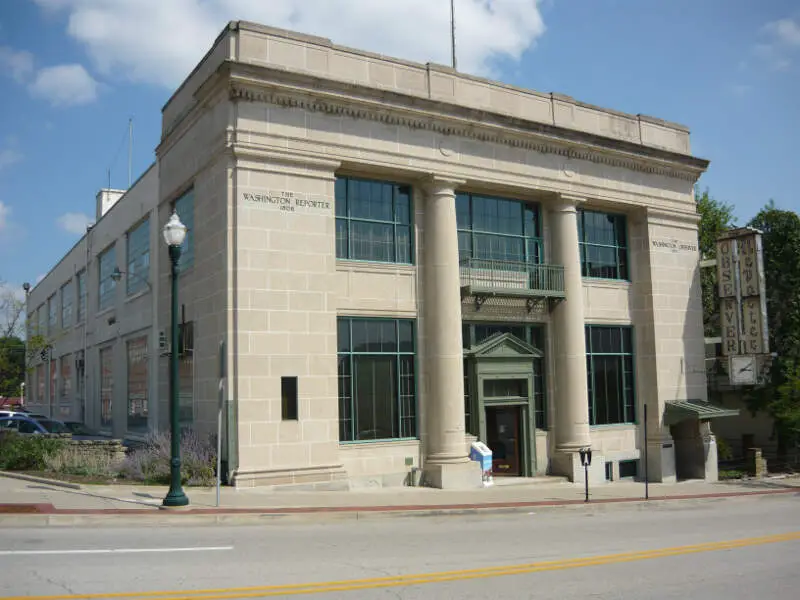
Washington, PA Photos

1 Reviews & Comments About Washington
/5

Master Gracey - None
I live in Washington, and it's not too bad here at all.
Rankings for Washington in Pennsylvania


Locations Around Washington
Map Of Washington, PA
Best Places Around Washington
Pleasant Hills, PA
Population 8,418
Dormont, PA
Population 8,120
Castle Shannon, PA
Population 8,237
Whitehall, PA
Population 14,863
Brentwood, PA
Population 9,927
Jefferson Hills, PA
Population 12,313
Carnegie, PA
Population 8,015
Canonsburg, PA
Population 9,682
Washington Demographics And Statistics
Population over time in Washington
The current population in Washington is 13,361. The population has decreased -4.0% from 2010.
| Year | Population | % Change |
|---|---|---|
| 2023 | 13,361 | 0.0% |
| 2022 | 13,358 | 0.3% |
| 2021 | 13,322 | -0.6% |
| 2020 | 13,404 | -0.9% |
| 2019 | 13,532 | -0.4% |
| 2018 | 13,590 | -0.2% |
| 2017 | 13,624 | -0.5% |
| 2016 | 13,693 | 0.4% |
| 2015 | 13,642 | -0.5% |
| 2014 | 13,715 | -0.6% |
| 2013 | 13,803 | 0.6% |
| 2012 | 13,720 | -0.7% |
| 2011 | 13,814 | -0.7% |
| 2010 | 13,915 | - |
Race / Ethnicity in Washington
Washington is:
72.6% White with 9,698 White residents.
13.5% African American with 1,804 African American residents.
0.0% American Indian with 0 American Indian residents.
1.7% Asian with 231 Asian residents.
0.0% Hawaiian with 0 Hawaiian residents.
0.1% Other with 8 Other residents.
7.7% Two Or More with 1,028 Two Or More residents.
4.4% Hispanic with 592 Hispanic residents.
| Race | Washington | PA | USA |
|---|---|---|---|
| White | 72.6% | 73.8% | 58.2% |
| African American | 13.5% | 10.3% | 12.0% |
| American Indian | 0.0% | 0.1% | 0.5% |
| Asian | 1.7% | 3.7% | 5.7% |
| Hawaiian | 0.0% | 0.0% | 0.2% |
| Other | 0.1% | 0.4% | 0.5% |
| Two Or More | 7.7% | 3.3% | 3.9% |
| Hispanic | 4.4% | 8.4% | 19.0% |
Gender in Washington
Washington is 49.4% female with 6,606 female residents.
Washington is 50.6% male with 6,755 male residents.
| Gender | Washington | PA | USA |
|---|---|---|---|
| Female | 49.4% | 50.7% | 50.5% |
| Male | 50.6% | 49.3% | 49.5% |
Highest level of educational attainment in Washington for adults over 25
2.0% of adults in Washington completed < 9th grade.
7.0% of adults in Washington completed 9-12th grade.
42.0% of adults in Washington completed high school / ged.
18.0% of adults in Washington completed some college.
11.0% of adults in Washington completed associate's degree.
13.0% of adults in Washington completed bachelor's degree.
4.0% of adults in Washington completed master's degree.
2.0% of adults in Washington completed professional degree.
1.0% of adults in Washington completed doctorate degree.
| Education | Washington | PA | USA |
|---|---|---|---|
| < 9th Grade | 2.0% | 3.0% | 5.0% |
| 9-12th Grade | 7.0% | 5.0% | 6.0% |
| High School / GED | 42.0% | 33.0% | 26.0% |
| Some College | 18.0% | 15.0% | 19.0% |
| Associate's Degree | 11.0% | 9.0% | 9.0% |
| Bachelor's Degree | 13.0% | 21.0% | 21.0% |
| Master's Degree | 4.0% | 10.0% | 10.0% |
| Professional Degree | 2.0% | 2.0% | 2.0% |
| Doctorate Degree | 1.0% | 2.0% | 2.0% |
Household Income For Washington, Pennsylvania
4.9% of households in Washington earn Less than $10,000.
6.5% of households in Washington earn $10,000 to $14,999.
11.5% of households in Washington earn $15,000 to $24,999.
10.2% of households in Washington earn $25,000 to $34,999.
14.8% of households in Washington earn $35,000 to $49,999.
22.7% of households in Washington earn $50,000 to $74,999.
14.9% of households in Washington earn $75,000 to $99,999.
9.6% of households in Washington earn $100,000 to $149,999.
3.3% of households in Washington earn $150,000 to $199,999.
1.8% of households in Washington earn $200,000 or more.
| Income | Washington | PA | USA |
|---|---|---|---|
| Less than $10,000 | 4.9% | 4.8% | 4.9% |
| $10,000 to $14,999 | 6.5% | 3.7% | 3.6% |
| $15,000 to $24,999 | 11.5% | 7.0% | 6.6% |
| $25,000 to $34,999 | 10.2% | 7.1% | 6.8% |
| $35,000 to $49,999 | 14.8% | 10.7% | 10.4% |
| $50,000 to $74,999 | 22.7% | 16.1% | 15.7% |
| $75,000 to $99,999 | 14.9% | 12.9% | 12.7% |
| $100,000 to $149,999 | 9.6% | 17.6% | 17.4% |
| $150,000 to $199,999 | 3.3% | 9.0% | 9.3% |
| $200,000 or more | 1.8% | 11.1% | 12.6% |


