Want to know where you can live the South Carolina dream in some of the richest places in the state? You’ve come to the right place.
We created a list of the top ten wealthiest places to live in The Palmetto State for 2026. Incidentally, this is our eleventh time ranking the cities in this Southern state, so believe us when we say that South Carolina’s most prosperous places are the creme de la creme.
To identify South Carolina’s wealthiest places, we used Saturday Night Science to analyze the latest Census and Zillow data on incomes and home prices. We limited the analysis to 91 Indiana cities with more than 3,000 residents.
Now, if you want to live in South Carolina’s richest places, you will have to bring home the bacon. The median income for many in the top ten will require that you have a solid job in something like finance, healthcare, or engineering.
$156,979 median income · 2.5% poverty · #1 income in South Carolina
Data | Crime | Cost of living | Movers
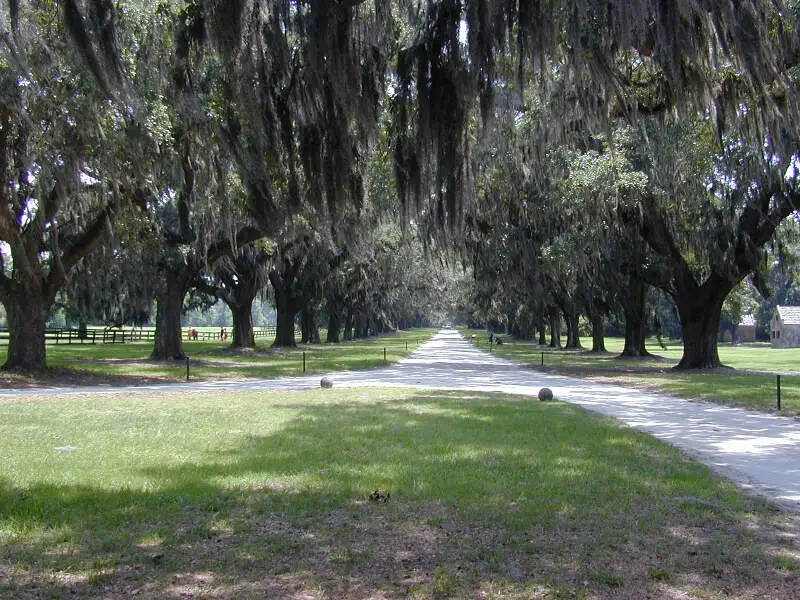
$124,755 median income · 6.1% poverty · #3 income in South Carolina
 Located in
Charleston County, South Carolina
Located in
Charleston County, South Carolina
Mount Pleasant is a large suburban town in Charleston County, South Carolina, United States. It is the fourth largest municipality and largest town in South Carolina, and for several years was one of the state’s fastest-growing areas, doubling in population between 1990 and 2000. The population was 67,843 at the 2010 census, and the estimated population in 2014 was 77,796. Mount Pleasant is the third largest city in the Charleston- North Charleston- Summerville metropolitan area, behind Charleston and North Charleston.
Data | Crime | Cost of living | Movers
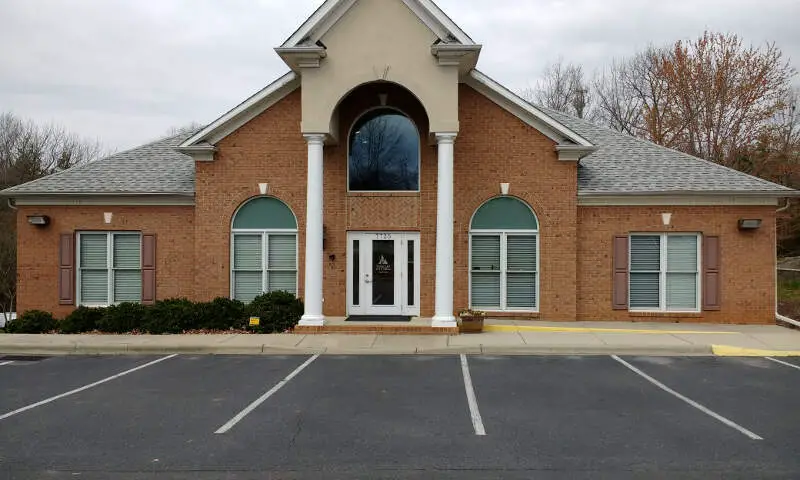
$142,000 median income · 1.5% poverty · #2 income in South Carolina
 Located in
York County, South Carolina
Located in
York County, South Carolina
Data | Crime | Cost of living | Movers
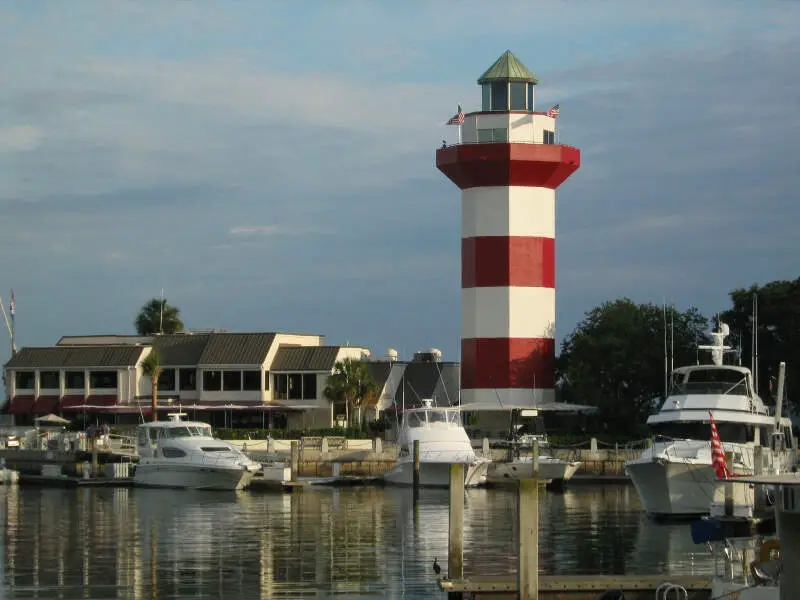
$94,657 median income · 8.6% poverty · #7 income in South Carolina
 Located in
Beaufort County, South Carolina
Located in
Beaufort County, South Carolina
Hilton Head Island, sometimes referred to as simply Hilton Head, is a Lowcountry resort town and barrier island in Beaufort County, South Carolina, United States. It is 20 miles northeast of Savannah, Georgia, and 95 miles southwest of Charleston. The island is named after Captain William Hilton, who in 1663 identified a headland near the entrance to Port Royal Sound, which he named “Hilton’s Head” after himself. The island features 12 miles of beachfront on the Atlantic Ocean and is a popular vacation destination. In 2004, an estimated 2.25 million visitors pumped more than $1.5 billion into the local economy. The year-round population was 37,099 at the 2010 census, although during the peak of summer vacation season the population can swell to 150,000. Over the past decade, the island’s population growth rate was 32%. Hilton Head Island is a primary city within the Hilton Head Island-Bluffton-Beaufort metropolitan area, which had an estimated population of 207,413 in 2015.
Data | Crime | Cost of living | Movers
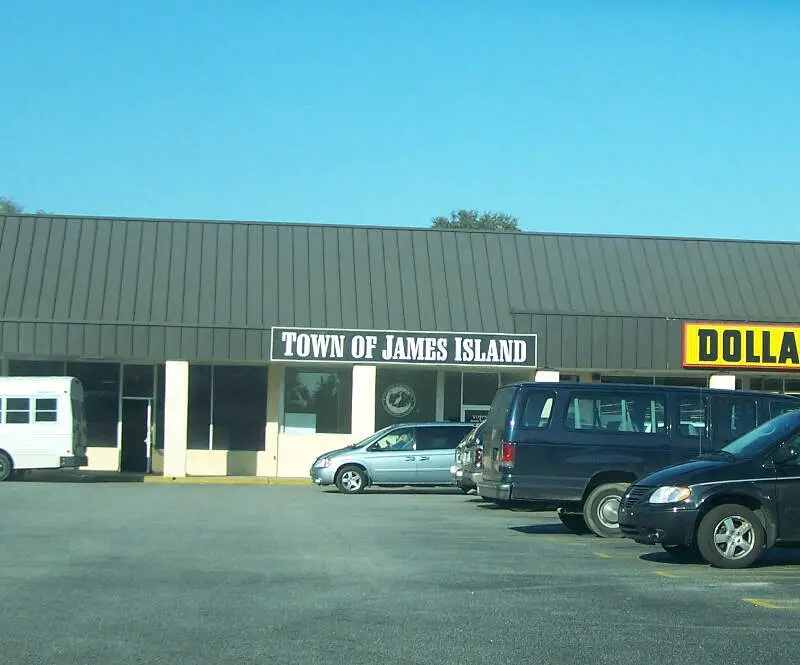
$104,217 median income · 5.6% poverty · #6 income in South Carolina
 Located in
Charleston County, South Carolina
Located in
Charleston County, South Carolina
James Island is a town in Charleston County, South Carolina, United States. It is located in the central and southern parts of James Island. As defined by the U.S. Office of Management and Budget, and used by the U.S. Census Bureau for statistical purposes only, James Island is included within the Charleston-North Charleston-Summerville metropolitan area and the Charleston-North Charleston Urbanized Area.
Data | Crime | Cost of living | Movers
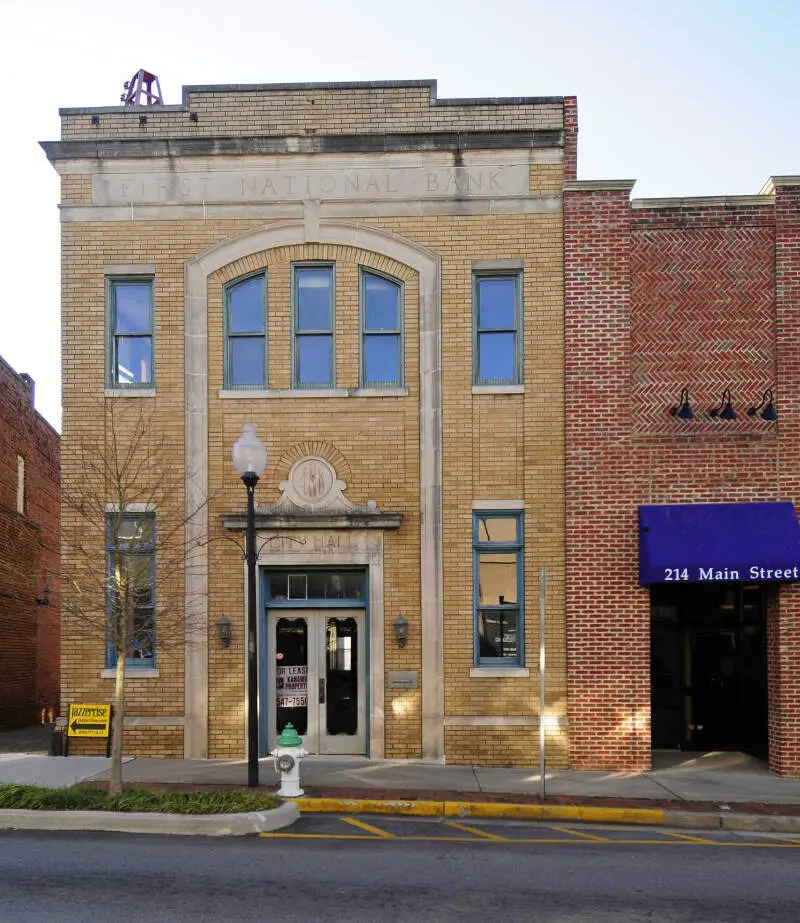
$121,823 median income · 4.8% poverty · #4 income in South Carolina
 Located in
York County, South Carolina
Located in
York County, South Carolina
Fort Mill, also known as Fort Mill Township, is a town in York County in the U.S. state of South Carolina. It is a suburb of the city of Charlotte, North Carolina and is located north of Rock Hill. As of 2015, approximately 13,662 people live inside the town’s corporate limits with a total of 36,119 people residing within the entire township. Some businesses and residents in the Indian Land community of neighboring Lancaster County often use Fort Mill as their city address as it is the nearest incorporated area, but the official town boundary is located only in York County.
Data | Crime | Cost of living | Movers
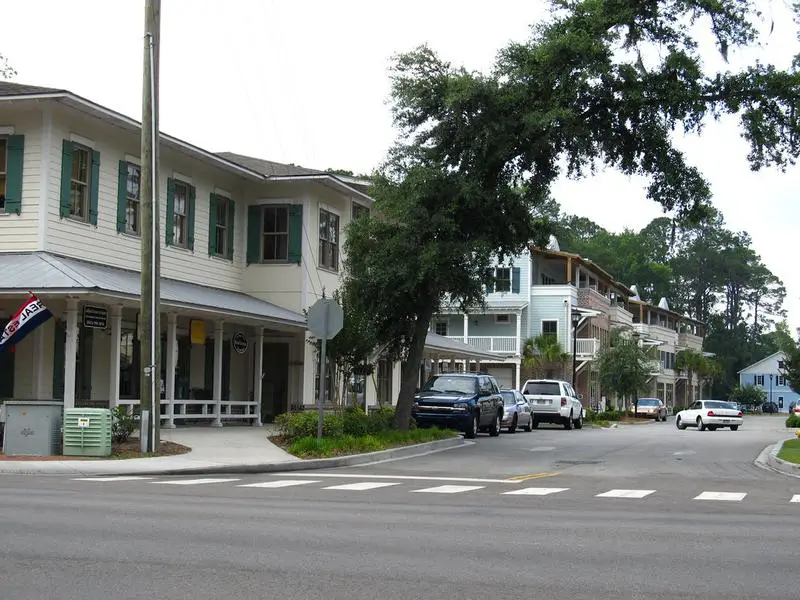
$111,281 median income · 4.3% poverty · #5 income in South Carolina
 Located in
Beaufort County, South Carolina
Located in
Beaufort County, South Carolina
Bluffton is a Lowcountry town in Beaufort County, South Carolina, United States. It is primarily located around U.S. Route 278, between Hilton Head Island and Interstate 95. The town’s original one square mile area, now known as Old Town, is situated on a bluff along the May River. The population was counted by the 2010 census at 12,893. Bluffton is the fastest growing municipality in South Carolina with a population over 2,500, growing 882.7% between the 2000 and 2010 census. Bluffton is the fifth largest municipality in South Carolina by land area. The town is a primary city within the Hilton Head Island-Bluffton-Beaufort, SC Metropolitan Statistical Area. Bluffton is known for its eclectic Old Town district and natural views of the May River. It has been called “the last true coastal village of the South.”
Data | Crime | Cost of living | Movers
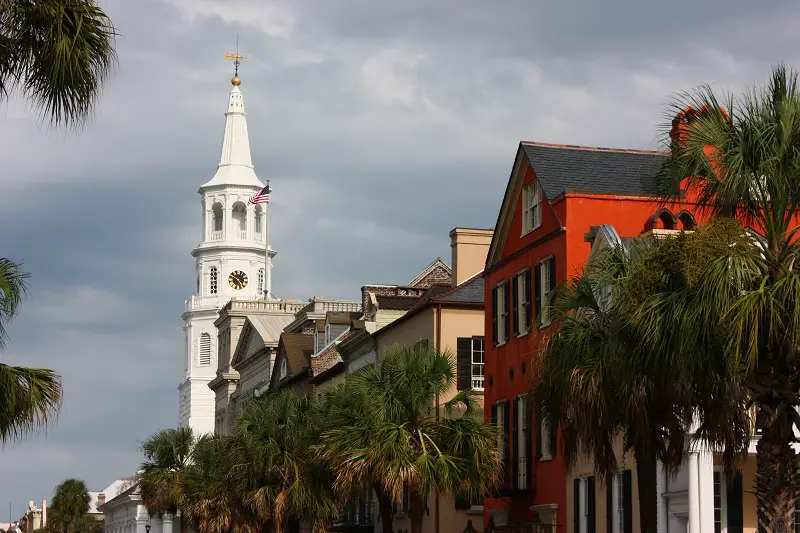
$92,414 median income · 12.3% poverty · #9 income in South Carolina
 Located in
Charleston County, South Carolina
Located in
Charleston County, South Carolina
Charleston is the oldest and largest city in the U.S. state of South Carolina, the county seat of Charleston County, and the principal city in the Charleston-North Charleston-Summerville Metropolitan Statistical Area. The city lies just south of the geographical midpoint of South Carolina’s coastline and is located on Charleston Harbor, an inlet of the Atlantic Ocean formed by the confluence of the Ashley and Cooper rivers. Charleston had an estimated population of 134,385 in 2016. The estimated population of the Charleston metropolitan area, comprising Berkeley, Charleston, and Dorchester counties, was 761,155 residents in 2016, the third-largest in the state and the 78th-largest metropolitan statistical area in the United States.
Data | Crime | Cost of living | Movers

$87,984 median income · 11.7% poverty · #12 income in South Carolina
 Located in
Berkeley County, South Carolina
Located in
Berkeley County, South Carolina
Data | Crime | Cost of living | Movers

$85,450 median income · 8.3% poverty · #15 income in South Carolina
 Located in
York County, South Carolina
Located in
York County, South Carolina
Clover is a town in York County, South Carolina, United States located in the greater Charlotte, North Carolina, metropolitan area. As of 2010, the population was at 5,094 within the town limits. Clover is twinned with the Northern Irish town of Larne on County Antrim’s East Coast.
Data | Crime | Cost of living | Movers
The receipts
Compare the top ten
Pick a metric. The bars rescale. The red line is South Carolina’s statewide median.
South Carolina statewide median: $69,324
South Carolina statewide median: $304,083
South Carolina statewide median: 14.1%
South Carolina statewide median: 4.9%
On the map
Where the money lives in South Carolina
Saturday Night Science
How we determined the richest places in South Carolina for 2026
The first thing most people reach for is personal income. After all, rich people have really high salaries. But one statistic doesn’t capture what it means to be one of the “richest places,” so we applied Saturday Night Science to two measures from the 2020-2024 American Community Survey:
- Median household income
- Median home value
Median household income is the most digestible way to understand how rich a place is, and home values are a measure of accumulated wealth. The two combine to define a “Rich City.”
After collecting the data for all 91 places in South Carolina with more than 3,000 people, we ranked each place from 1 to 91 on both criteria, then averaged the two ranks into a “Rich Score.” The place with the lowest Rich Score, Isle of Palms, is crowned the richest city in South Carolina for 2026. The median South Carolina home is 33 years old — old enough that it pays to compare home warranty plans before something expensive breaks.
The full plate
All 91 richest cities in South Carolina, ranked
Click any column to sort. Search by city name.
| Rank | City | Rich Score | Population | Median income | Median home value | Poverty | Unemployment |
|---|---|---|---|---|---|---|---|
| 1 | Isle of Palms | 1.00 | 4,362 | $156,979 | $1,616,638 | 2.5% | 1.3% |
| 2 | Mount Pleasant | 2.50 | 93,993 | $124,755 | $875,092 | 6.1% | 3.3% |
| 3 | Tega Cay | 3.00 | 13,615 | $142,000 | $611,048 | 1.5% | 2.2% |
| 4 | Hilton Head Island | 5.00 | 37,911 | $94,657 | $787,679 | 8.6% | 3.0% |
| 5 | James Island | 5.50 | 12,198 | $104,217 | $597,131 | 5.6% | 1.2% |
| 6 | Fort Mill | 5.50 | 30,775 | $121,823 | $527,208 | 4.8% | 2.3% |
| 7 | Bluffton | 7.00 | 33,157 | $111,281 | $498,492 | 4.3% | 2.2% |
| 8 | Charleston | 7.50 | 154,338 | $92,414 | $589,607 | 12.3% | 3.4% |
| 9 | Hanahan | 12.50 | 21,452 | $87,984 | $404,452 | 11.7% | 2.5% |
| 10 | Clover | 13.00 | 7,234 | $85,450 | $413,528 | 8.3% | 4.8% |
| 11 | Moncks Corner | 14.00 | 15,485 | $91,500 | $360,391 | 8.3% | 3.6% |
| 12 | Hardeeville | 15.50 | 10,871 | $78,365 | $426,445 | 11.8% | 7.3% |
| 13 | Blythewood | 16.00 | 5,731 | $94,167 | $340,026 | 4.8% | 5.0% |
| 14 | Simpsonville | 16.50 | 26,144 | $82,457 | $377,970 | 6.1% | 4.1% |
| 15 | Hollywood | 17.00 | 5,382 | $73,693 | $519,343 | 12.2% | 2.5% |
| 16 | Summerville | 18.00 | 51,654 | $81,046 | $376,903 | 10.1% | 4.9% |
| 17 | Greer | 19.50 | 41,536 | $82,626 | $348,460 | 10.1% | 2.4% |
| 18 | Goose Creek | 20.50 | 48,078 | $88,178 | $318,055 | 6.5% | 2.7% |
| 19 | North Myrtle Beach | 21.50 | 19,855 | $72,722 | $390,621 | 7.4% | 4.0% |
| 20 | Port Royal | 22.50 | 15,579 | $74,870 | $355,157 | 8.4% | 1.0% |
| 21 | Forest Acres | 23.50 | 10,530 | $78,306 | $335,524 | 8.2% | 4.1% |
| 22 | Lexington | 25.00 | 24,585 | $87,126 | $303,204 | 7.4% | 5.2% |
| 23 | Beaufort | 26.50 | 13,747 | $61,220 | $412,456 | 12.5% | 3.6% |
| 24 | Surfside Beach | 26.50 | 4,270 | $70,106 | $352,699 | 16.8% | 8.6% |
| 25 | Greenville | 27.50 | 72,935 | $71,472 | $327,592 | 14.0% | 4.4% |
| 26 | Mauldin | 28.50 | 27,055 | $82,331 | $297,318 | 8.4% | 4.9% |
| 27 | Rock Hill | 29.50 | 75,259 | $68,771 | $326,184 | 12.6% | 5.8% |
| 28 | Lyman | 30.00 | 6,547 | $75,653 | $303,651 | 6.1% | 3.4% |
| 29 | Fountain Inn | 30.50 | 12,020 | $73,585 | $305,626 | 7.7% | 4.7% |
| 30 | Easley | 32.00 | 24,841 | $66,299 | $315,980 | 13.9% | 3.2% |
| 31 | Irmo | 32.50 | 11,813 | $80,489 | $281,255 | 9.2% | 8.4% |
| 32 | North Augusta | 32.50 | 25,653 | $86,092 | $265,723 | 6.6% | 3.8% |
| 33 | Ridgeland | 33.00 | 3,764 | $62,981 | $318,106 | 26.8% | 2.5% |
| 34 | York | 34.50 | 8,969 | $56,176 | $356,169 | 15.9% | 2.2% |
| 35 | North Charleston | 35.00 | 119,913 | $62,956 | $309,522 | 14.4% | 4.3% |
| 36 | Myrtle Beach | 35.00 | 38,371 | $60,394 | $320,925 | 19.0% | 5.4% |
| 37 | Aiken | 35.50 | 32,521 | $76,746 | $272,072 | 17.0% | 5.4% |
| 38 | Woodruff | 36.00 | 4,538 | $70,959 | $284,467 | 14.2% | 4.8% |
| 39 | Inman | 36.50 | 3,166 | $63,599 | $302,760 | 15.4% | 3.5% |
| 40 | Travelers Rest | 38.00 | 8,370 | $54,583 | $353,916 | 22.0% | 6.2% |
| 41 | Clemson | 38.50 | 18,072 | $49,520 | $396,341 | 36.0% | 4.5% |
| 42 | Williamston | 40.00 | 4,170 | $64,389 | $279,925 | 13.5% | 7.9% |
| 43 | Pendleton | 42.00 | 3,594 | $61,901 | $282,414 | 21.8% | 2.5% |
| 44 | Central | 43.00 | 5,320 | $60,258 | $284,221 | 30.3% | 4.4% |
| 45 | Duncan | 44.50 | 4,310 | $52,500 | $308,640 | 12.4% | 5.4% |
| 46 | Conway | 44.50 | 27,263 | $56,650 | $286,177 | 21.0% | 8.3% |
| 47 | Camden | 45.50 | 8,267 | $63,576 | $237,603 | 13.2% | 8.2% |
| 48 | Seneca | 46.00 | 8,993 | $52,022 | $304,236 | 22.1% | 8.9% |
| 49 | Wellford | 47.00 | 3,515 | $57,338 | $267,203 | 16.2% | 0.4% |
| 50 | Georgetown | 50.00 | 8,565 | $56,981 | $250,504 | 21.9% | 9.4% |
| 51 | Pickens | 51.50 | 3,155 | $55,000 | $271,726 | 16.7% | 1.3% |
| 52 | West Columbia | 53.00 | 17,963 | $56,912 | $226,049 | 13.7% | 4.8% |
| 53 | Cayce | 53.50 | 13,741 | $62,045 | $210,165 | 13.7% | 5.3% |
| 54 | Lancaster | 54.00 | 8,921 | $46,311 | $291,062 | 21.2% | 9.6% |
| 55 | Columbia | 55.50 | 139,643 | $55,529 | $229,068 | 24.0% | 7.5% |
| 56 | Florence | 56.00 | 40,408 | $56,143 | $219,285 | 18.9% | 5.4% |
| 57 | Anderson | 57.00 | 30,051 | $46,933 | $272,108 | 21.0% | 6.8% |
| 58 | Spartanburg | 57.50 | 38,910 | $51,964 | $233,687 | 23.8% | 7.4% |
| 59 | Walterboro | 58.00 | 5,480 | $56,457 | $210,403 | 28.2% | 6.1% |
| 60 | Sumter | 58.50 | 43,053 | $55,592 | $213,463 | 16.7% | 6.6% |
| 61 | Belton | 59.00 | 4,458 | $49,107 | $263,491 | 19.6% | 7.0% |
| 62 | Burne | 60.50 | 3,135 | $50,347 | $222,838 | 19.6% | 6.4% |
| 63 | Liberty | 62.50 | 3,350 | $42,206 | $261,044 | 21.5% | 2.1% |
| 64 | Andrews | 63.00 | 3,485 | $57,247 | $153,728 | 27.2% | 1.3% |
| 65 | Barnwell | 66.00 | 4,613 | $52,006 | $169,128 | 23.9% | 13.8% |
| 66 | Batesburg-Leesville | 66.50 | 4,941 | $49,646 | $182,850 | 15.1% | 3.5% |
| 67 | Newberry | 67.50 | 10,790 | $51,260 | $166,455 | 31.5% | 6.9% |
| 68 | Hartsville | 68.50 | 7,419 | $49,272 | $179,199 | 19.6% | 7.2% |
| 69 | Laurens | 68.50 | 9,336 | $49,246 | $180,131 | 25.4% | 1.9% |
| 70 | Walhalla | 68.50 | 4,157 | $36,327 | $230,203 | 45.9% | 6.5% |
| 71 | Edgefield | 69.50 | 4,010 | $39,688 | $216,234 | 31.4% | 12.4% |
| 72 | Abbeville | 70.50 | 4,872 | $40,575 | $211,891 | 27.3% | 7.5% |
| 73 | Gaffney | 71.50 | 12,596 | $41,089 | $185,841 | 29.1% | 10.6% |
| 74 | Greenwood | 71.50 | 22,536 | $41,150 | $183,963 | 21.6% | 8.7% |
| 75 | Clinton | 73.00 | 7,676 | $44,522 | $163,866 | 27.7% | 4.9% |
| 76 | Honea Path | 73.50 | 3,739 | $32,900 | $218,833 | 33.6% | 15.5% |
| 77 | Saluda | 74.50 | 3,055 | $42,506 | $160,085 | 43.9% | 3.7% |
| 78 | Manning | 76.00 | 3,863 | $28,569 | $215,524 | 17.7% | 7.2% |
| 79 | Orangeburg | 77.00 | 13,253 | $38,635 | $162,436 | 32.6% | 11.8% |
| 80 | Chester | 77.50 | 5,218 | $46,138 | $128,680 | 19.4% | 7.6% |
| 81 | Winnsboro | 79.00 | 3,322 | $37,434 | $155,105 | 12.8% | 7.7% |
| 82 | Darlington | 82.50 | 6,120 | $33,952 | $153,323 | 30.2% | 7.1% |
| 83 | Mullins | 83.50 | 3,914 | $34,908 | $131,098 | 38.3% | 10.1% |
| 84 | Cheraw | 84.50 | 4,960 | $26,689 | $156,880 | 37.0% | 11.8% |
| 85 | Dillon | 85.00 | 6,354 | $35,891 | $100,984 | 32.8% | 8.0% |
| 86 | Bennettsville | 85.00 | 7,751 | $37,115 | $81,007 | 28.4% | 12.5% |
| 87 | Union | 85.00 | 8,079 | $31,914 | $136,356 | 28.9% | 11.4% |
| 88 | Marion | 85.00 | 6,206 | $30,662 | $145,563 | 26.8% | 4.7% |
| 89 | Lake City | 85.50 | 5,988 | $33,600 | $126,633 | 25.7% | 9.7% |
| 90 | Kingstree | 89.50 | 3,132 | $26,322 | $113,951 | 33.9% | 6.8% |
| 91 | Denmark | 89.50 | 3,117 | $27,451 | $99,224 | 35.1% | 20.4% |
Source: U.S. Census ACS 2020-2024, Zillow research. 91 cities with more than 3,000 residents.
Isle of Palms is the richest place in South Carolina for 2026
When we set out to identify the richest places in South Carolina, we weren’t sure what we’d find, but it ended up being some of the best places to live in the state. The richest cities in South Carolina are Isle of Palms, Mount Pleasant, and Tega Cay, and when you look at the data they sit at the very top of the income ladder for everyone who lives there.
Breaking into the top ten takes a median household income of at least $85,450. If you’re curious about the other end of the ledger, the poorest places are listed to the right. Not sold on South Carolina? Take the two-minute Find Your Place quiz and see which state actually fits you.
Questions and answers
Richest Cities In South Carolina FAQs
What is the richest city in South Carolina?
Isle of Palms is the richest city in South Carolina for 2026. The median household income in Isle of Palms is $156,979, the median home value is $1,616,638, and the poverty rate sits at 2.5%. Mount Pleasant and Tega Cay round out the top three.
Where do the richest people live in South Carolina?
The richest people in South Carolina live in Isle of Palms, Mount Pleasant, and Tega Cay, based on income and home value data from the American Community Survey. Every place in the top ten posts a median household income of at least $85,450.
How much money do you need to be considered rich in South Carolina?
You need a household income around $85,450 to keep up in the ten richest places in South Carolina. That is the lowest median income in the top ten; the highest is $156,979. The statewide median is $69,324.
How expensive are homes in the richest cities in South Carolina?
The median home value across the ten richest cities in South Carolina is $593,369, compared to $304,083 statewide. In Isle of Palms, the typical home runs $1,616,638.
What is the poorest city in South Carolina?
Denmark is the poorest city in South Carolina. It ranks last of the 91 places we analyzed on income and home value.